Note: The visualizations adhere to the Vault Time Zone, not the Timezone specified in your User Profile.
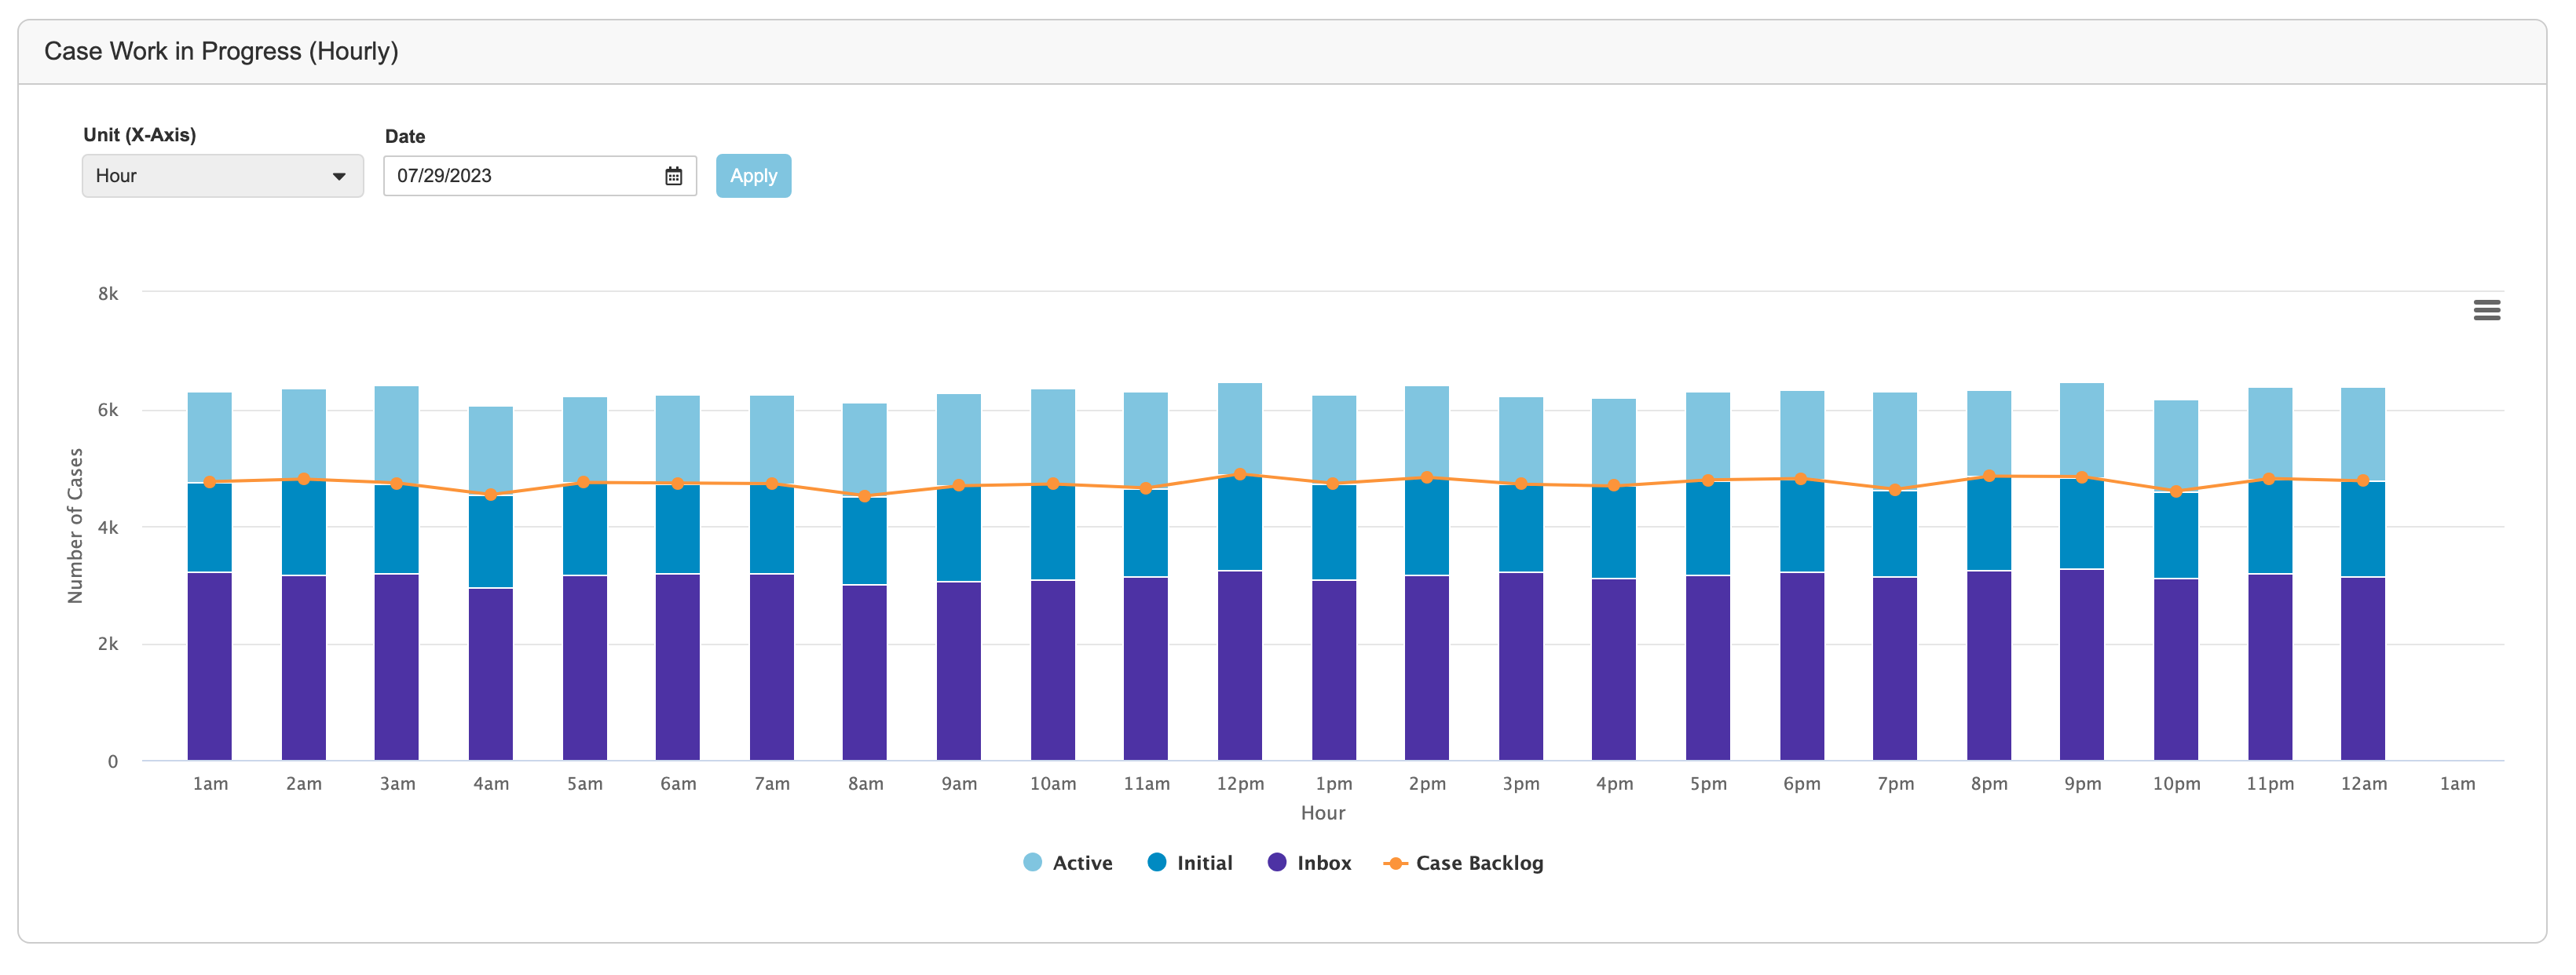
### Case Work in Progress {#in-progress}
In a given period of time, this chart illustrates the number of:
* **Active _Cases_**: _Cases_ in a lifecycle state that Vault considers as active, which depends on your Admin's configuration.
* **Initial _Cases_**: _Cases_ in a lifecycle state that Vault considers as initial, which depends on your Admin's configuration.
* **_Inbox Items_**: _Inbox Items_ that are not in one of the following lifecycle states:
* _Promoted_
* _Duplicate_
* _Rejected_
* _Superseded_
* **_Cases_ in backlog**: The sum of initial _Cases_ and _Inbox Items_.
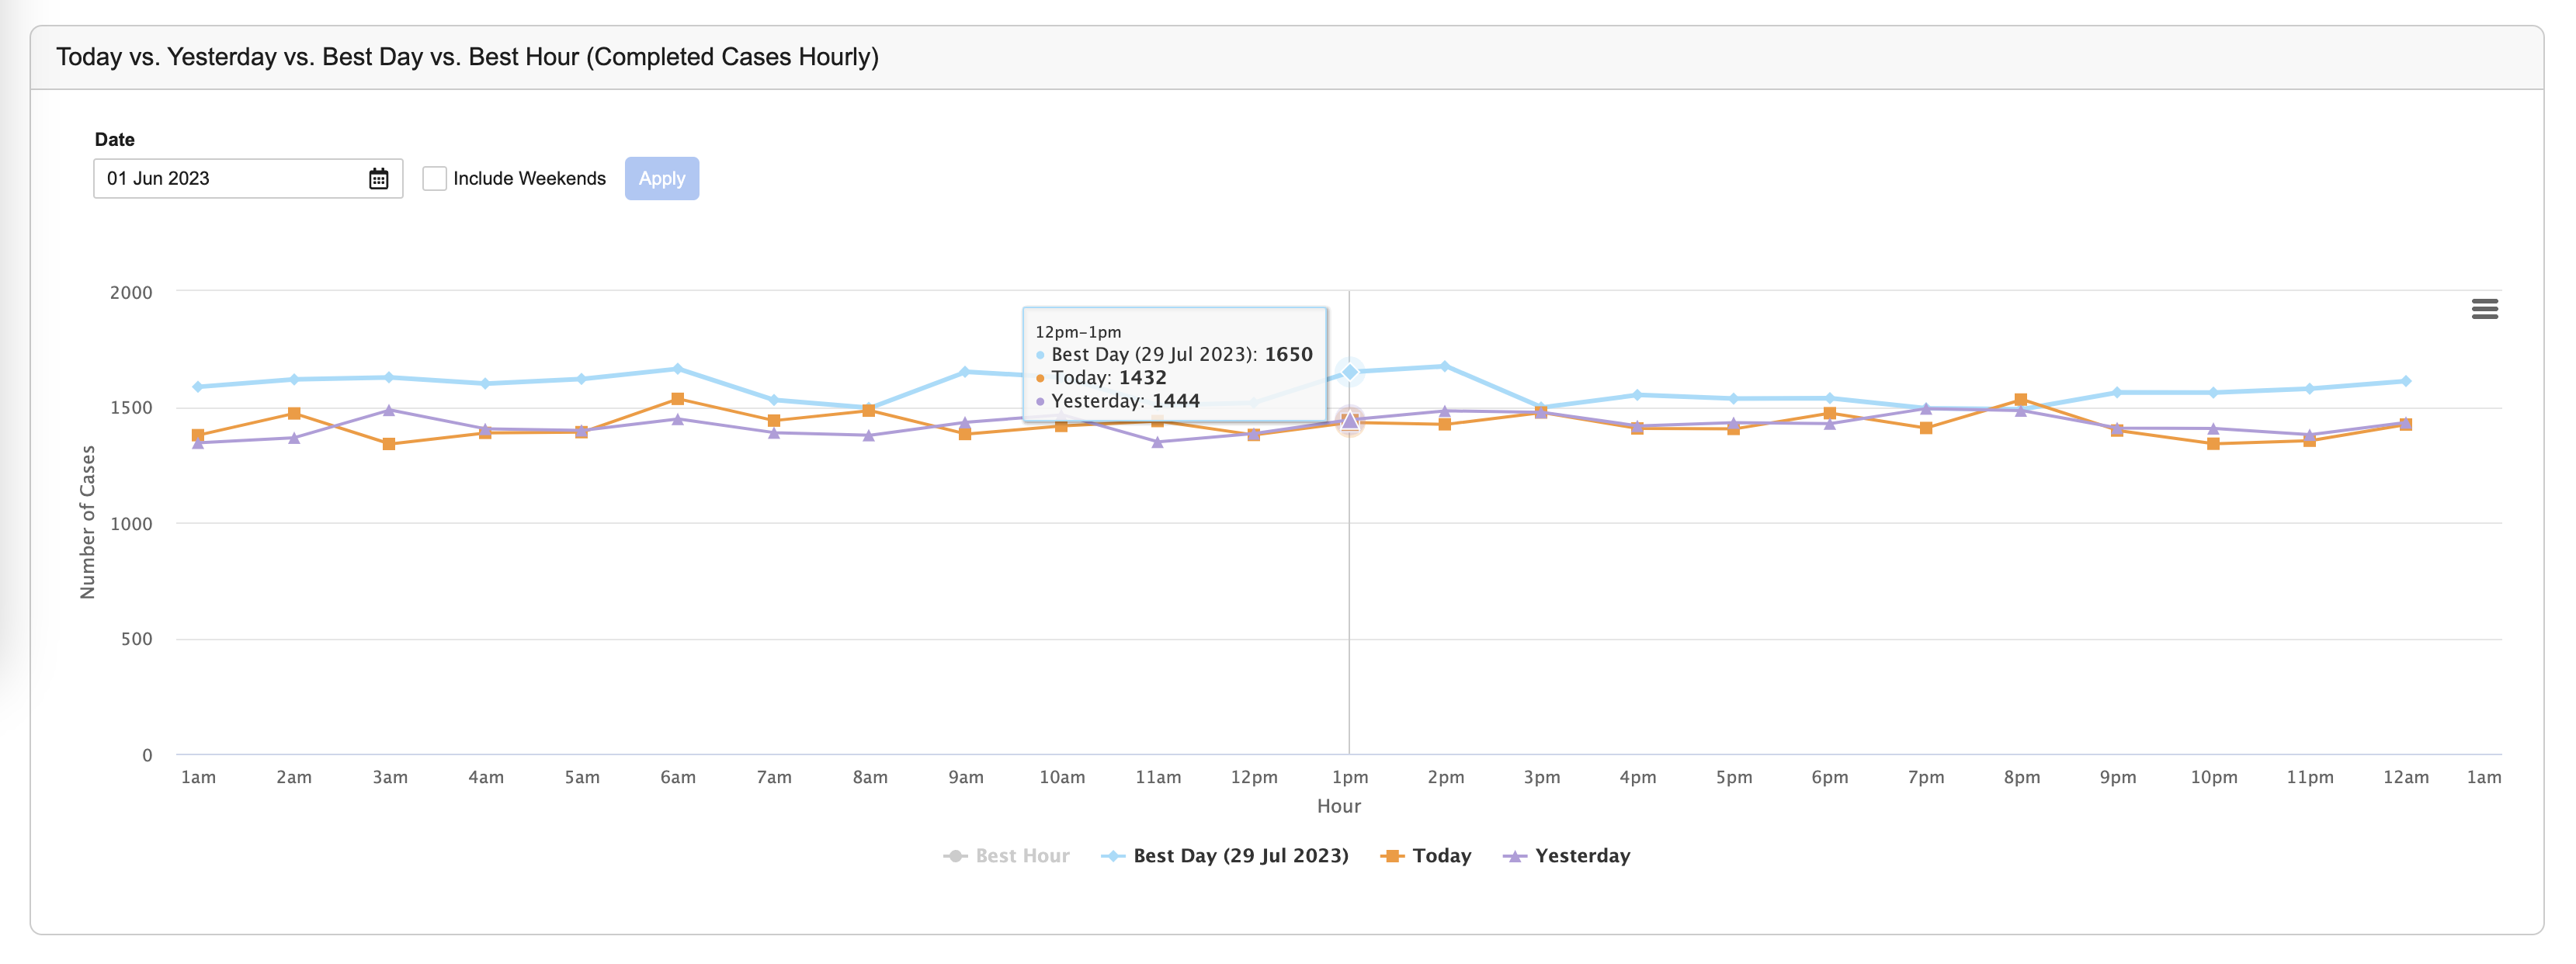
 ### Today vs. Yesterday vs. Best Day vs. Best Hour {#day-hour}
This chart compares the number of completed _Cases_ for today, yesterday, the most optimal day, and the most optimal hour. These _Cases_ are in a lifecycle state that Vault considers as completed, which depends on your Admin's configuration.
### Today vs. Yesterday vs. Best Day vs. Best Hour {#day-hour}
This chart compares the number of completed _Cases_ for today, yesterday, the most optimal day, and the most optimal hour. These _Cases_ are in a lifecycle state that Vault considers as completed, which depends on your Admin's configuration.
 In the _Completed Cases_ and the _Case Work in Progress_ charts, you can modify the _Unit (X-Axis)_ to adjust the time measurement (for example, Day). You can then specify the dates and choose to include weekends if available.
After adjusting the chart options, select **Apply** to view the metrics.
Hover over the data points on the graph to display a hovercard with more information.
You can also select the X-Axis legend values to remove their data from the chart.
Finally, you can use the chart menu (
In the _Completed Cases_ and the _Case Work in Progress_ charts, you can modify the _Unit (X-Axis)_ to adjust the time measurement (for example, Day). You can then specify the dates and choose to include weekends if available.
After adjusting the chart options, select **Apply** to view the metrics.
Hover over the data points on the graph to display a hovercard with more information.
You can also select the X-Axis legend values to remove their data from the chart.
Finally, you can use the chart menu ( ) to print or download the respective chart in your preferred format.
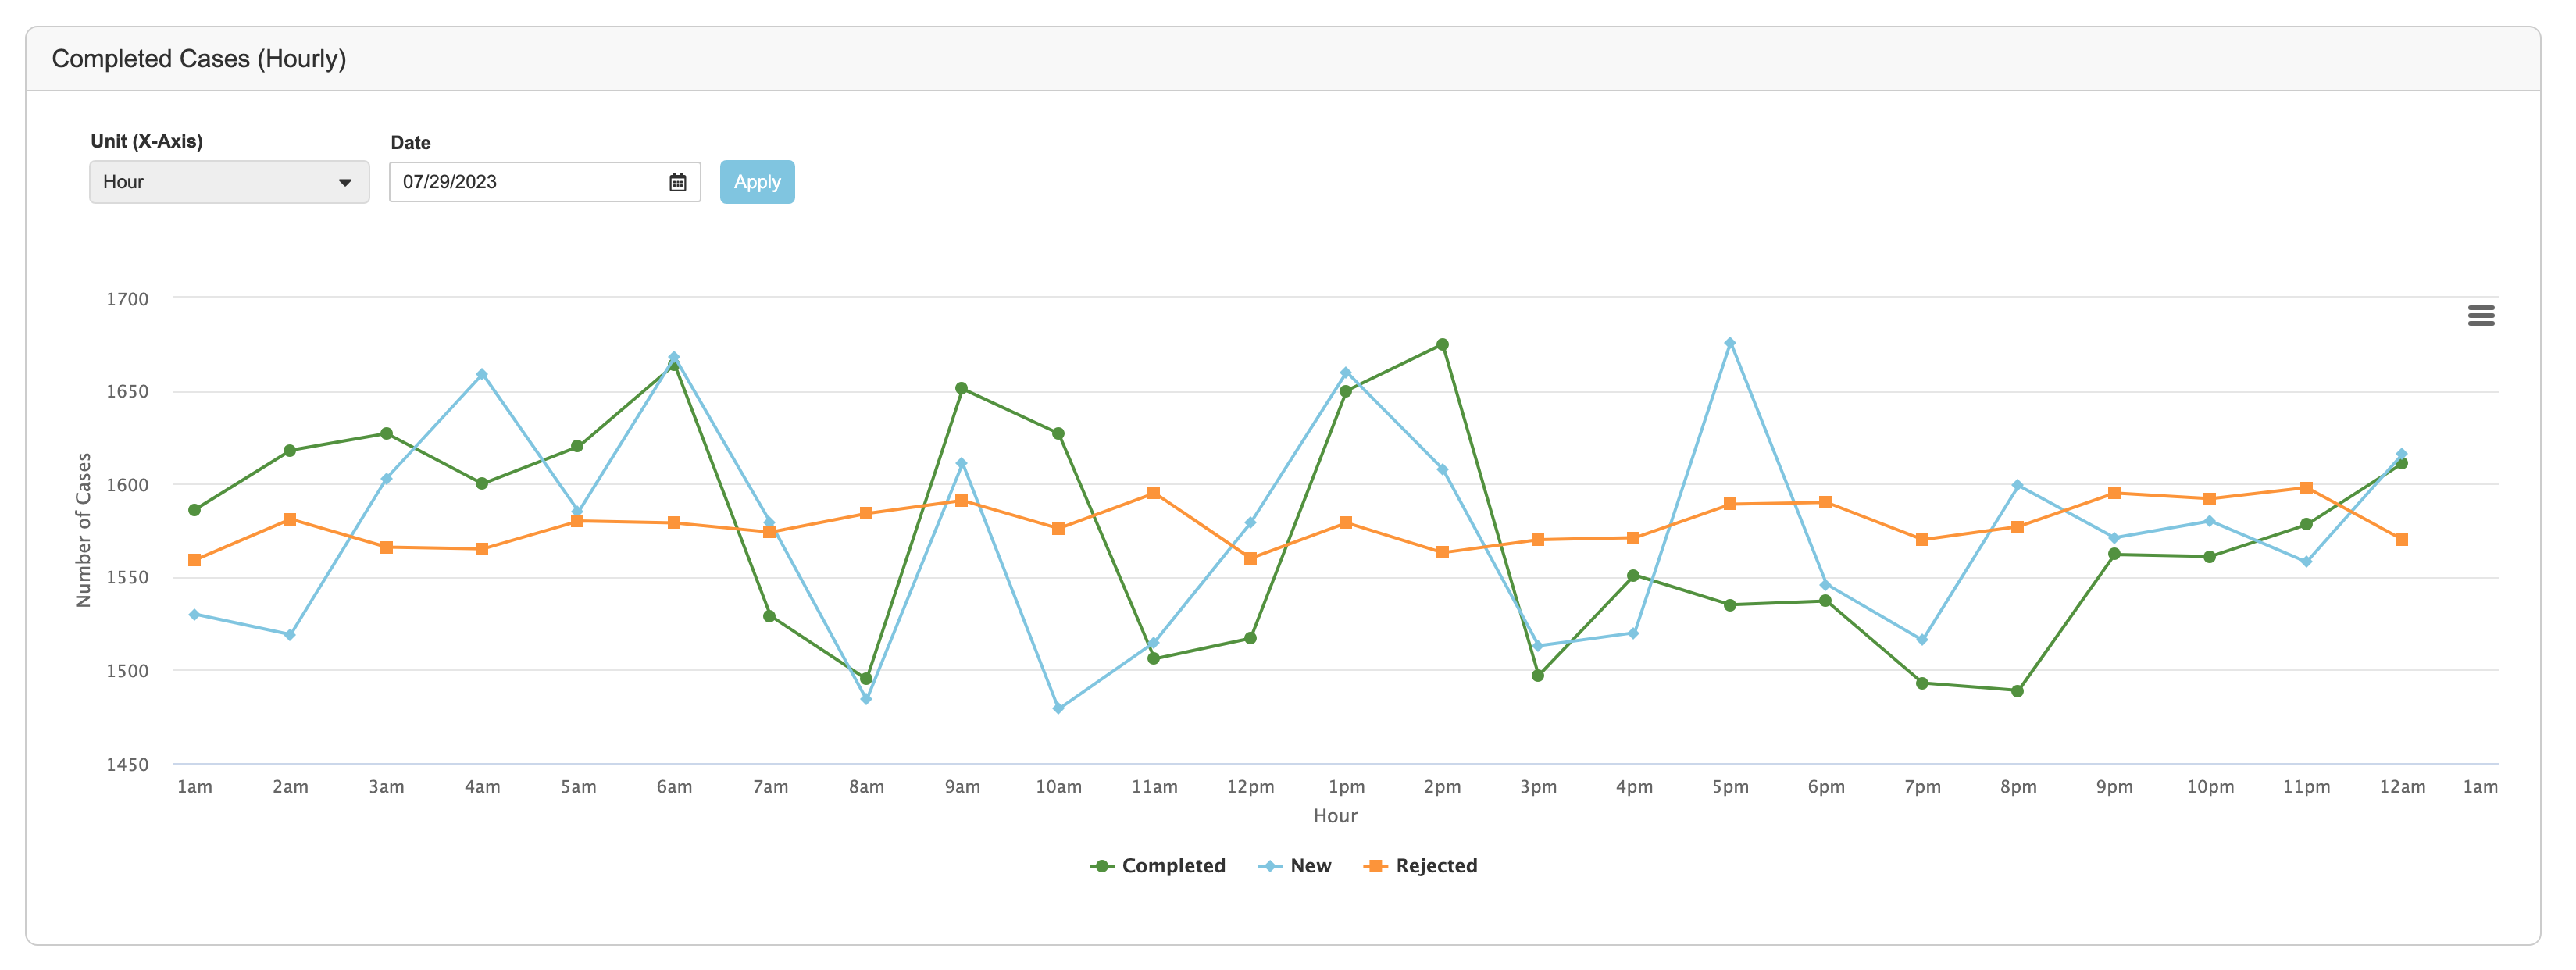
The job records in **Business Admin** include a _Scheduled Datetime_, which is the date and time the Case Volume Metrics job ran. When you populate a date or date range on a chart, the system uses the _Scheduled Datetime_ to display _Inbox Item_ and _Case_ counts. For example, when viewing the _Completed Cases_ chart by hour on a given day, Vault uses the hourly _Scheduled Datetime_ values for that day to present dashboard data.
[1]: #completed
[2]: #in-progress
[3]: #day-hour
) to print or download the respective chart in your preferred format.
The job records in **Business Admin** include a _Scheduled Datetime_, which is the date and time the Case Volume Metrics job ran. When you populate a date or date range on a chart, the system uses the _Scheduled Datetime_ to display _Inbox Item_ and _Case_ counts. For example, when viewing the _Completed Cases_ chart by hour on a given day, Vault uses the hourly _Scheduled Datetime_ values for that day to present dashboard data.
[1]: #completed
[2]: #in-progress
[3]: #day-hour