# Creating Reports

Reports help you answer important business questions about documents, workflows, and object records in your Vault. For example, a report could help you identify:

* Which users have overdue tasks
* How long the MLR review process usually takes in your Vault
* Statuses of each site within a study

This article covers how to build a matrix or tabular report. For details on filtering or grouping with conditional fields, see <a href="/en/lr/8591/">Using Report Filters</a>.


### How to Create Reports {#how-to-create-reports}


The following video demonstrates how to create a report:
<video controls width=860 height =504  preload="metadata">
    <source src="https://platform.veevavault.help/108e9b1d-559c-4d48-918b-1e4c5b5a533c/cfa53781-b9ec-485a-ab18-67b1e8944b53/cfa53781-b9ec-485a-ab18-67b1e8944b53_source__v.mp4#t=0.5" type="video/mp4" >
    
    <track
    label="English"
    kind="subtitles"
    srclang="en"
    src="/en/lr/assets/captions/25r1-reporting-overview-create-a-report.vtt"
    default />
    </video>

<a href="/en/lr/676782/">Details</a>


  1. From the **Reports** tab, click **Create > Report**.
  2. From the _Create Report_ menu, select a **Report Type** to indicate the kind of data that your report should include. See details on [report type][1].
  3. Click **Continue**.
  4. Optional: Enter a **Name** and **Description** for the report, and select any applicable **Tags**. If you skip this step, you can enter these details when saving the report.
  5. Make selections for the various report options.
  6. Click **Continue** to open the report builder. See report builder details for [tabular][2] or [matrix][3] reports.
  7. In the report builder, configure the [formula fields][5], [conditional fields][22], <a href="/en/lr/8591/">filters</a>, [advanced options][6], and any other options as needed.
  8. Click **Run** to view the results. If needed, you can return to the report builder and modify the report details.
  9. Click **Save** when you're satisfied with the report.
  After building the report, you may want to <a href="/en/lr/3622/">share or export</a> it."

## Basic Report Options {#report-options}

In the first screen of report creation, the options you select control the results that appear in your report and the format of the report.

### Report Type {#report-type}

Report Type determines the "reporting objects" for the new report. For example, Document means that your report will only look at documents, whereas Product with Campaign means that your report looks at _Product_ and _Campaign_ records. Learn more about <a href="/en/lr/39659/">report types</a>.

### Document Type

By selecting a document type in the **Create Report** page, you:

* Limit the documents in the report to only those with the specified document type, subtype, or classification. You can also accomplish this by creating filters in the report builder.
* Limits the document fields available for selection as columns, filters, etc. Without a document type selected, all document fields are available. With a document type selected, only fields defined for the selected type and its subtypes or classifications are available.

### Including Previous Document Versions

By default, reports only include the latest version of a document, with one row for each document. Selecting the **Include previous document versions** checkbox includes all previous versions of a document.

Cross-version reports include:

* A separate row for each major and minor version you have access to which fits the report's filters
* A sortable and filterable _Version_ column that combines the major and minor version numbers (0.1, 0.2, 1.0, etc.)
* A filterable _State Type_ field that shows the special state type (Steady, Superseded, etc.) for each document version
* Filterable _Steady State Begin_ and _Steady State End_ fields indicating the first and last date on which a document version was in its lifecycle's _Steady_ state

This option is available for the _Document_, _Rendition_, and _[Object] with Document_ report types.

Note that reports show only documents and versions that the report viewer can access. If necessary, you can use the _Is Latest Version_ boolean field to differentiate between the latest and previous versions of documents in the report.


### Introduction to Report Formats {#report-format}


This video demonstrates how to choose the best format for your report.

* Tabular reports show individual records in report rows and can include many columns, for example, a listing of sites by study, with site details like _Status_ and _Location_.
* Matrix reports group by values for the selected fields in both columns and rows and perform a summary calculation in the cells, for example, an average MLR review time by _Coordinator_ and _Subtype_.
<video controls width=860 height =504  preload="metadata">
    <source src="https://platform.veevavault.help/108e9b1d-559c-4d48-918b-1e4c5b5a533c/c8792d68-8a77-4224-b575-8f99c817c046/c8792d68-8a77-4224-b575-8f99c817c046_source__v.mp4#t=0.5" type="video/mp4" >
    
    <track
    label="English"
    kind="subtitles"
    srclang="en"
    src="/en/lr/assets/captions/25r1-reporting-overview-tabular-and-matrix-reports.vtt"
    default />
    </video>

<a href="/en/lr/676798/">Details</a>


### Document Scope

If your Vault uses the Document Archive feature, you can choose to report on either archived documents or active documents using the **Document Scope** selection. You will only see this option if your security profile includes the View Archive permission.

_Document Scope_ is available for the _Document_ report type.

## Tabular Reports {#tabular}

In a tabular report, each row represents an individual record: a document, document version, study, product, etc. Reports with multiple reporting objects show rows grouped by the primary object. For example, a _Product with Document_ report would show the WonderDrug product row followed by rows for each WonderDrug document, and then a row for the CholeCap product, etc.


### Building Tabular Reports Demo {#building-tabular-reports}


The following video demonstrates how to build a tabular report with filters and grouping.
<video controls width=860 height =504  preload="metadata">
    <source src="https://platform.veevavault.help/108e9b1d-559c-4d48-918b-1e4c5b5a533c/cdd4cb73-049f-41eb-8c12-24af8d22105d/cdd4cb73-049f-41eb-8c12-24af8d22105d_source__v.mp4#t=0.5" type="video/mp4" >
    
    <track
    label="English"
    kind="subtitles"
    srclang="en"
    src="/en/lr/assets/captions/24r3-building-tabular-reports.vtt"
    default />
    </video>

<a href="/en/lr/676771/">Details</a>


### Adding Columns

By default, new reports include a column showing the _Name_ field for each reporting object. You can add columns to show additional fields. Some columns aren't related to a specific field, for example, the [Actions column][7], [count column][8], and various <a href="/en/lr/25450/">workflow or task columns</a>.

To add columns:

  1. Click **Edit Column(s)**.
  2. In the **Edit Column to Display** dialog, fields are grouped and color-coded according to their related object (_Product_, _Document_, etc.).
  3. Choose fields from **Available Columns** and move them to **Displayed Columns**. The **Restore** link here reverts the displayed columns to the last saved values.
  4. Click **Save**.

<div class="note-border alert-info">
  <div class="alert alert-info" role="alert">
    <div><i class="far fa-info-circle"></i></div>
    <div class="alert-text">
      <p><strong>Note</strong>: When you add columns to Union-All reports, you can choose from unioned fields defined by the report type or non-unioned fields belonging to specific objects. Unioned fields will be prefixed in the column selector with the name of the Union-All report type. Non-unioned fields will be prefixed with the component they are related to.</p>
    </div>
  </div>
</div>


### Column Count Limits

You can create tabular reports with up to 100 columns. When adding columns to a tabular report, the _Edit Columns to Display_ dialog shows a count of columns added to the report, for example, **56/100**. If you have added 100 columns, Vault disables the _Add selected columns_ (<img class="inline" src="https://platform.veevavault.help/assets/images/platform_report_dialog_add_selected_column.png" alt="Add selected columns icon" style="" />) button and you cannot add additional columns.

### Setting Column Aliases

You can rename a column in the report viewer and exported report results by setting a column alias. This is only available if you select **Enable filter and column aliases** under _Advanced Options_ during report creation.

To set, remove, or change a column alias:

  1. Click the pencil icon in the column header.
  2. Enter an **Alias**. Remove the alias by clicking **Clear**.
  3. Click **OK**.

Admins can localize column aliases using <a href="/en/lr/13309/#bulk-translation">Bulk Translation export and import</a>.

### Adding Groups {#groups}

Use groups to organize your documents by a specific field. You can create up to two levels of grouping, for example, you could group a document report by _Product_ and then by _Marketing Campaign_.

To add a group:

  1. Click the **Group rows by** drop-down menu and choose a field.
  2. Add a secondary grouping by clicking **Add field to group by** and choosing another grouping field.
  3. Click **Save**.

### Defining Functions on Fields {#defining-field-functions}

If you group rows in a tabular report, you can add several aggregate functions on text, number, and date fields. You can only select one function per field. Vault does not support aggregate functions on long or rich text fields.

<div class="note-border alert-info">
  <div class="alert alert-info" role="alert">
    <div><i class="far fa-info-circle"></i></div>
    <div class="alert-text">
      <p><strong>Note</strong>: Vault does not support aggregate functions on the first column of a report. We recommend rearranging columns or using formula fields to apply aggregate functions to the first column.</p>
    </div>
  </div>
</div>


Available aggregate functions include:

| Aggregate Function | Definition | Notes |
| --- | --- | --- |
| List | Returns concatenated text of all row values in a group separated by a delimiter and space | Displays a maximum of 1,024 characters; only available for text fields |
| Distinct List | Returns concatenated text of all row values in a group, excluding duplicates, separated by a delimiter and space | Displays a maximum of 1,024 characters; only available for text fields |
| Std Dev | Returns the population standard deviation of expression | Only available on number type fields |
| Std Dev Samp | Returns the sample standard deviation of an expression | Only available on number type fields |

To add an aggregate function, click the **Function** drop-down on a grouping in the report editor and select a function.

#### <span id="defining_summary_calculations">Additional Summary Calculations on Number Fields</span>

If you group rows in a tabular report, you can choose to perform summary calculations on number, date, count, and ID fields. For example, you could show the average number of pages for a specific document type by grouping on _Type_ and selecting the _Avg_ calculation on the _Pages_ column.

If you rearrange columns so that the number column is the first column, the report viewer cannot show an aggregate value on that column.

### Sorting Results {#sorting}

By default, reports sort on the _Name_ value for the primary reporting object, for example, _Product Name_ in the _Product with Document_ report type. You can set a different sort order.

To sort results for the primary reporting object:

  1. Click on a column header to sort by that column. Vault sorts (ascending) by this column's value.
  2. To sort descending, click on the column header again. The column header shows an arrow indicating the current sort (up for ascending and down for descending).
  3. Click **Save**.

If you apply a grouping to report rows, you can set the sort order for the groups:

  1. In the **Sort groups by** drop-down list, choose a sort order.
  2. Click **Save**.

You can also sort on any field for an up object that the primary reporting object references. For example, in a report showing marketing campaigns with documents, you could sort by the _Product Approval Date_. This field belongs to the _Product_ object referenced by the _Marketing Campaign_ object.

### Setting Column Width

By defining a column width in the report builder, Vault saves the setting and applies it when any user views the report. Users can also modify column widths when viewing, but these changes are not saved.

To set column widths:

  1. Move your cursor to the line between two columns.
  2. Drag the line to resize the columns.
  3. Click **Save**.

### Reordering Report Objects {#reorder_objects}

For <a href="/en/lr/39659/#up_and_down_objects">reports with multiple up objects</a>, you can change the order in which objects appear to emphasize those that are most important.

  1. Click **Edit Columns**.
  2. In the **Edit Columns to Display** dialog, click a bolded object label for a primary or up object in **Displayed Columns**. You cannot select down objects.
  3. Click the up and down arrow buttons to move the object.
  4. Click **Ok** to save your object arrangement.

You'll see your report's new order in the report builder, the report viewer, and report exports.

This option is available for the _Object_ report type.

### Export Options

You can select whether to <a href="/en/lr/3622/#export-options">export reports</a> with the full text of long text fields and rich text fields under **Advanced Options** > **Export Options**.

## Matrix Reports {#matrix}

When building a matrix report, you select grouping fields for both the rows and columns. You also select a calculation for Vault to perform in the union of each row and column. For example, you could group rows by _Subtype_, group columns by _Coordinator_, and then average the _MLR Review Time_ field value in the cells.


### Building Matrix Reports {#building-matrix-reports}


This following video demonstrates how to build a matrix report with filters and grouping.
<video controls width=860 height =504  preload="metadata">
    <source src="https://platform.veevavault.help/108e9b1d-559c-4d48-918b-1e4c5b5a533c/bf9562b7-b89f-4dba-a3c6-4d05d036f152/bf9562b7-b89f-4dba-a3c6-4d05d036f152_source__v.mp4#t=0.5" type="video/mp4" >
    
    <track
    label="English"
    kind="subtitles"
    srclang="en"
    src="/en/lr/assets/captions/24r3-building-matrix-reports.vtt"
    default />
    </video>

<a href="/en/lr/676769/">Details</a>


## Selecting Columns

Click **Edit Columns** to select which columns are displayed on the report and in what order. In the _Edit Columns_ dialog, select the columns you want and click the **Add** (<i class="fas fa-caret-right"></i>) and **Remove** (<i class="fas fa-caret-left"></i>) buttons to move them between the **Available Columns** and **Displayed Columns** lists. Reorder the columns on the **Displayed Columns** list by selecting the columns and clicking the **Move up** (<i class="fas fa-caret-up"></i>), **Move down** (<i class="fas fa-caret-down"></i>), **Move to the top** (<i class="fas fa-step-forward fa-rotate-270"></i>), and **Move to the bottom** (<i class="fas fa-step-forward fa-rotate-90"></i>) buttons.

### Selecting Grouping Fields

Select fields from the **Group columns by** and **Group rows by** drop-down lists.

### Defining Summary Calculations

By default, a matrix report counts the number of records that match the criteria defined by the column and row fields. To use a different calculation, select a function from the picklist in the cell. When choosing a summary calculation other than **Count**, select a numeric, date, or ID field on which to perform the calculation, for example, average of values for _MLR Review Time_. You must add grouped rows to your report before adding summary calculations.


### How to Perform Calculations Across Rows with Groups {#how-to-perform-calculations-across-rows-with-groups}


This video details how to select grouping fields and define summary calculations using the matrix report type.
<video controls width=860 height =504  preload="metadata">
    <source src="https://platform.veevavault.help/108e9b1d-559c-4d48-918b-1e4c5b5a533c/4f954c9e-085a-4a79-8280-9abb67e14fbf/4f954c9e-085a-4a79-8280-9abb67e14fbf_source__v.mp4#t=0.5" type="video/mp4" >
    
    <track
    label="English"
    kind="subtitles"
    srclang="en"
    src="/en/lr/assets/captions/25r1-performing-calculations-across-rows-with-groups.vtt"
    default />
    </video>

<a href="/en/lr/676773/">Details</a>


## Binder Reports {#binder-reports}

Vault provides <a href="/en/lr/39659/#standard-report-types">standard report types</a> for reporting on binders and their contents: _Binder with Document_, _Binder Section with Document_, and _Binder Section with Document and Binder_. These report types allow you to report on binders with their structure and documents.

The document versions displayed in a binder report are based on the version binding settings of the binders. When running reports on binders, <a href="/en/lr/4486/#binder_display_options">unbound documents</a> will always display the _Latest Version_.

With binder reports, nested binders are displayed as documents within the parent binder, but the report does not show documents within the sub-binders. While Vault allows you to nest binders within binders, nodes within sub-binders at all levels contribute to the binder's total node count, and a node count over 10,000 may cause performance issues both within the binder itself and with binder reports. Therefore, we recommend against nesting binders within binders.

Multi-pass report views are supported for the _Binder with Document_ report type only.

## Special Columns {#special-columns}

Most columns simply use document or object fields, but some columns are metrics specific to reports. These are only available in tabular reports.

### Record Count Columns {#count}

Tabular reports offer "count" columns for each reporting object, for example, _Document Count_. You can display a count value as a _Number_ or a _Percent of Total_. For example, in a report that groups documents by product, you could show the percentage of documents for each product, of the total documents in the report.

#### Distinct Record Counts {#distinct-counts}

By default, Vault displays duplicate records and includes the duplicates in total counts. Duplicate records appear in reports with multiple objects and views where several objects or records use the same identifier.
If you group rows in a tabular report, you can choose to view distinct record counts. In the report editor, click the **Function** drop-down in the _ID_ column and select **Distinct Count**. You can view distinct counts as numbers or percentages. You can also sort by [distinct count][19].

### Action Columns {#actions}

In some reports, you can add the _Action_ column. This allows report viewers to access various actions from inside the report.

Actions that the report viewer does not have permission to access don't appear in the **Actions** menu, but the **Actions** menu always appears unless the workflow is complete for Workflow reports or task is complete for Read & Understood reports.

#### **Workflow Actions**

In workflow reports, the Actions menu shows the same options as **Active Workflows** page or **Active Workflow** panel, for example, **Add Participants** for workflows or **Reassign** for tasks.

The configuration of the report determines which actions are visible: if the row in the report does not contain task-level information, the **Actions** menu only shows workflow options.

#### **Distribution Actions**

Distribution reports show different actions based on the type of distribution displayed. For example, for controlled copies, report viewers can update the status of the distribution to reflect recalls.

## Formula Fields {#formula-fields}

<a href="/en/lr/52324/">Formula fields</a> allow you to define formulas in your reports. Similar to creating an <a href="/en/lr/44478/">object formula field,</a> you can select from a full list of objects or documents in the report. You can add a maximum of ten (10) formula fields on each report.

<div class="note-border alert-info">
  <div class="alert alert-info" role="alert">
    <div><i class="far fa-info-circle"></i></div>
    <div class="alert-text">
      <p><strong>Note</strong>: Formula fields are currently available only on object and document tabular and matrix reports, Union-All reports, and Multi-Pass reports.</p>
    </div>
  </div>
</div>


You can add formula fields as columns in your report, and use formulas for grouping, sorting, and filtering. You can also define formula fields in report views.

To define a formula:

  1. Under Formula Fields, select **Create Formula Field**.
  2. Select a **Formula Type**.
  3. Select an **Object**.
  4. Enter a **Label**.
  5. Select a **Return Type**.
  6. Enter a **Maximum Length**.
  7. Enter a **Formula Expression**. For more detailed instructions on writing the formula expression, see <a href="/en/lr/42857/">Creating Formulas in Vault.</a>
  8. Click **Check Syntax**. Vault will let you know if your expression is valid.
  9. Click **Save**.

To edit or delete a formula field, click the formula label.

### Aggregate Formula Fields {#aggregate-formula-fields}

You can create report formula fields using <a href="/en/lr/52324/#aggregate-functions">aggregate functions</a> to perform calculations across report rows using groups. The calculated data can also be used in report filters and prompts. A single report formula field can contain up to three aggregate functions.

For example, in an Invoice report grouped by Invoice > Customer ID, you can create a formula field that calculates an adjusted invoice total per customer. To calculate the adjusted invoice total, create an expression using the following aggregate functions: `SumRows(invoice__c.invoice_amount__c) - SumRows(invoice__c.shipping_cost__c)`. This formula field calculates the total invoice amount and subtracts the total shipping cost to return the adjusted invoice amount grouped by customer.

## Conditional Fields {#conditional-fields}

Conditional fields let you set up labels based on other field values. For example, the _Status Group_ conditional field could look at _Document Status_ for documents with different lifecycles and groups those statuses together: _Complete_ label for _Approved_, _Approved for Use_, _Approved for Distribution_ and _In Progress_ for _Pending Review_, _In Review_, _In Approval_, etc. You can then use the conditional field for grouping or as a column in a tabular report. You cannot use conditional fields as filters on the report.

<div class="note-border alert-info">
  <div class="alert alert-info" role="alert">
    <div><i class="far fa-info-circle"></i></div>
    <div class="alert-text">
      <p><strong>Note</strong>: Conditional fields are available for all report types except <em>Distribution</em>, <em>Binder</em>, and <em>Read &amp; Understood</em>.</p>
    </div>
  </div>
</div>


To define conditions:

  1. Under Conditional Fields, select **Create Conditional Field**. You can create up to five (5) conditional fields per report.
  2. Enter a label for the conditional field.
  3. Click **Create Category**. You can create up to nine (9) categories per conditional field plus one (1) default category.
  4. Select a field, operator, and value. Note that **equals** must match on one field only, whereas **In** allows you to select multiple fields.
  5. Select a color for the label with the color palette. This colors columns, bars, and pie wedges in the dashboard.
  6. Optional: If needed, define multiple conditions by clicking **Add condition**. You can add up to five (5) conditions to each category.
  7. Optional: If needed, define multiple categories by clicking **Create Category**.
  8. Fill in the **Default Category**. If none of the other conditions are satisfied, default category label and color will be used.
  9. Click **Save**.

Reports evaluate categories in order. If a record meets conditions in the first category, Vault applies the first category's label. If a record doesn't meet the conditions, Vault evaluates the next category. The default category applies to records that don't meet any of the conditions.

## Setting Advanced Options {#advanced-options}

When creating a report, the _Advanced Options_ section allows you to enable the following reporting options:

* Enable filter and column aliases
* Combine report prompts
* Show inactive fields
* Show inactive users
* Enable merge cells with same value

### Enabling Filter & Column Aliases

Setting the **Enable filter and column aliases** checkbox under _Advanced Options_ allows you to set aliases that appear for columns (tabular only) and filters in the report viewer and in the exported report. This option also allows you to remove the _Name_ column for each reporting object. Aliases are useful for reports sent to regulatory agencies that expect specific naming conventions for columns and filters. Learn more about aliases in <a href="/en/lr/8591/#hierarchy">Using Report Filters</a>.


### Combining Report Prompts {#combining-report-prompts}


Setting the **Combine Report Prompts** checkbox under _Advanced Options_ allows Vault to combine report prompts with the same object, label, operator, and data type into one prompt, simplifying repetitive filters in complex tabular and Multi-Pass reports. Combining report prompts does not affect the report filters or exported report cover page.
<video controls width=860 height =504  preload="metadata">
    <source src="https://platform.veevavault.help/108e9b1d-559c-4d48-918b-1e4c5b5a533c/3f0c9eb1-0244-4432-8d88-29d865b8d6e3/3f0c9eb1-0244-4432-8d88-29d865b8d6e3_source__v.mp4#t=0.5" type="video/mp4" >
    
    <track
    label="English"
    kind="subtitles"
    srclang="en"
    src="/en/lr/assets/captions/25r1-combining-report-prompts.vtt"
    default />
    </video>

<a href="/en/lr/676772/">Details</a>


### Showing Inactive Fields {#showing-inactive-fields}

Setting the **Show inactive fields** checkbox under _Advanced Options_ allows Vault to show inactive fields in all selected drop-downs and columns on the report. By default, the **Show inactive fields** checkbox is not selected. This option is only available if your reporting configuration is set to <a href="/en/lr/46041/#hiding-inactive-fields">allow inactive fields to be used in reports</a>.

### Showing Inactive Users {#showing-inactive-users}

Setting the **Show inactive users** checkbox under _Advanced Options_ allows Vault to show inactive users in all selected drop-downs and columns on the report. By default, the **Show inactive users** checkbox is selected. This option is only available if your reporting configuration is set to <a href="/en/lr/46041/#hiding-inactive-fields">allow inactive users to be used in reports</a>.

### Enabling Merged Cells

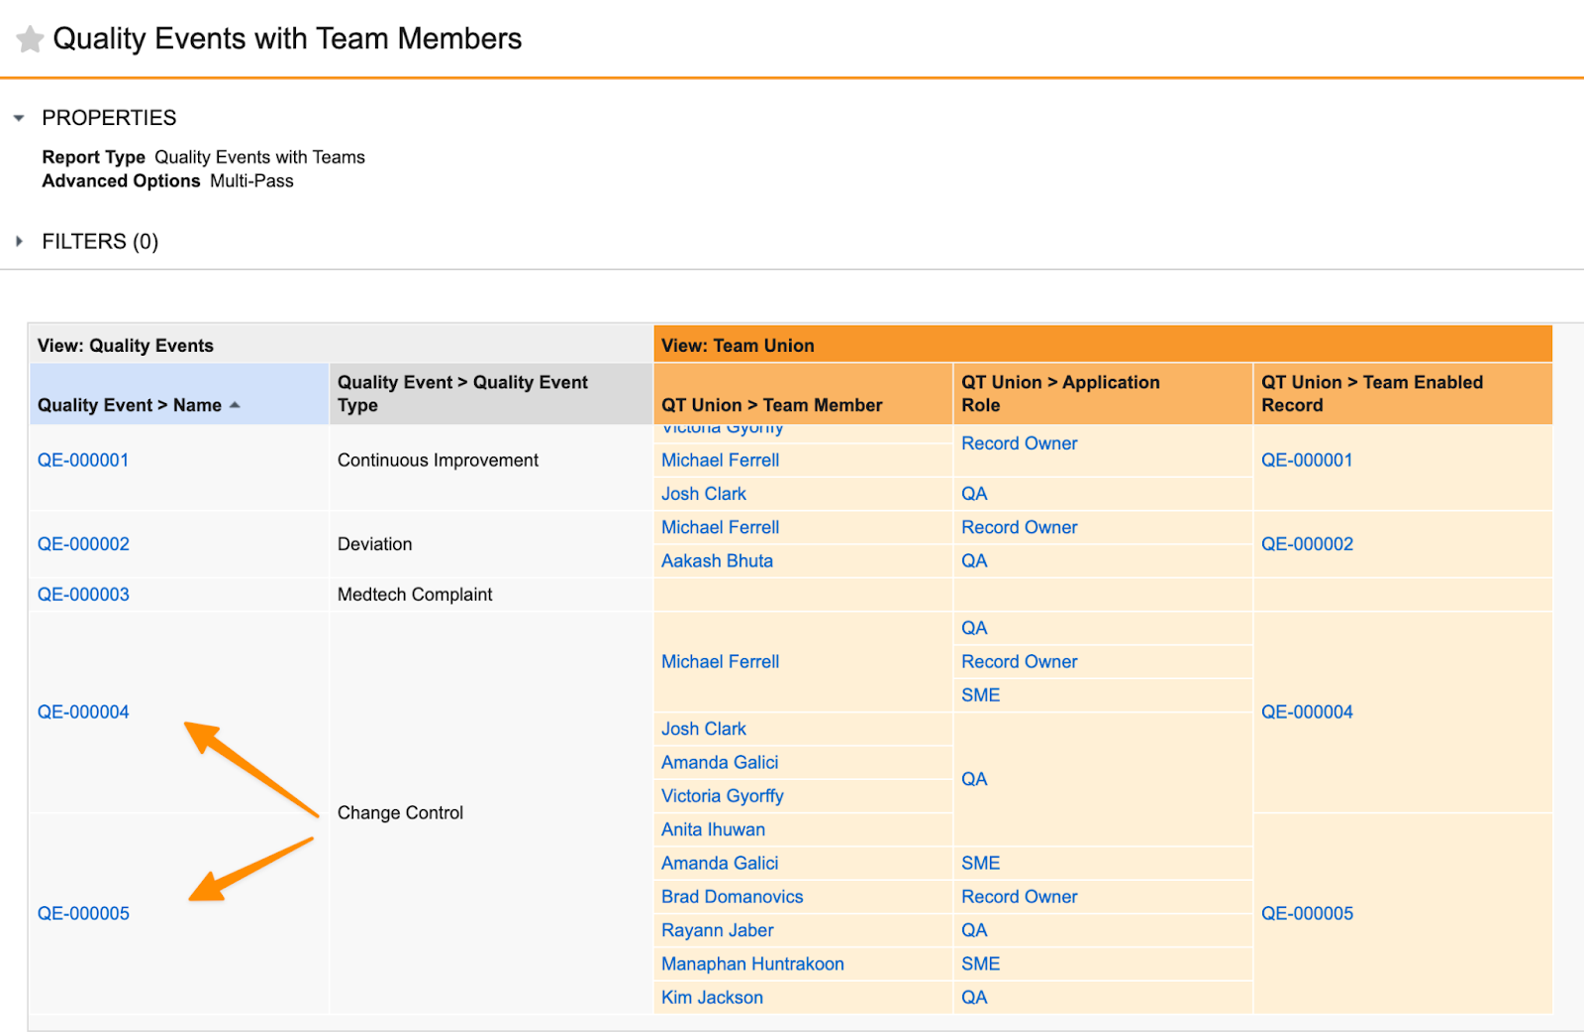
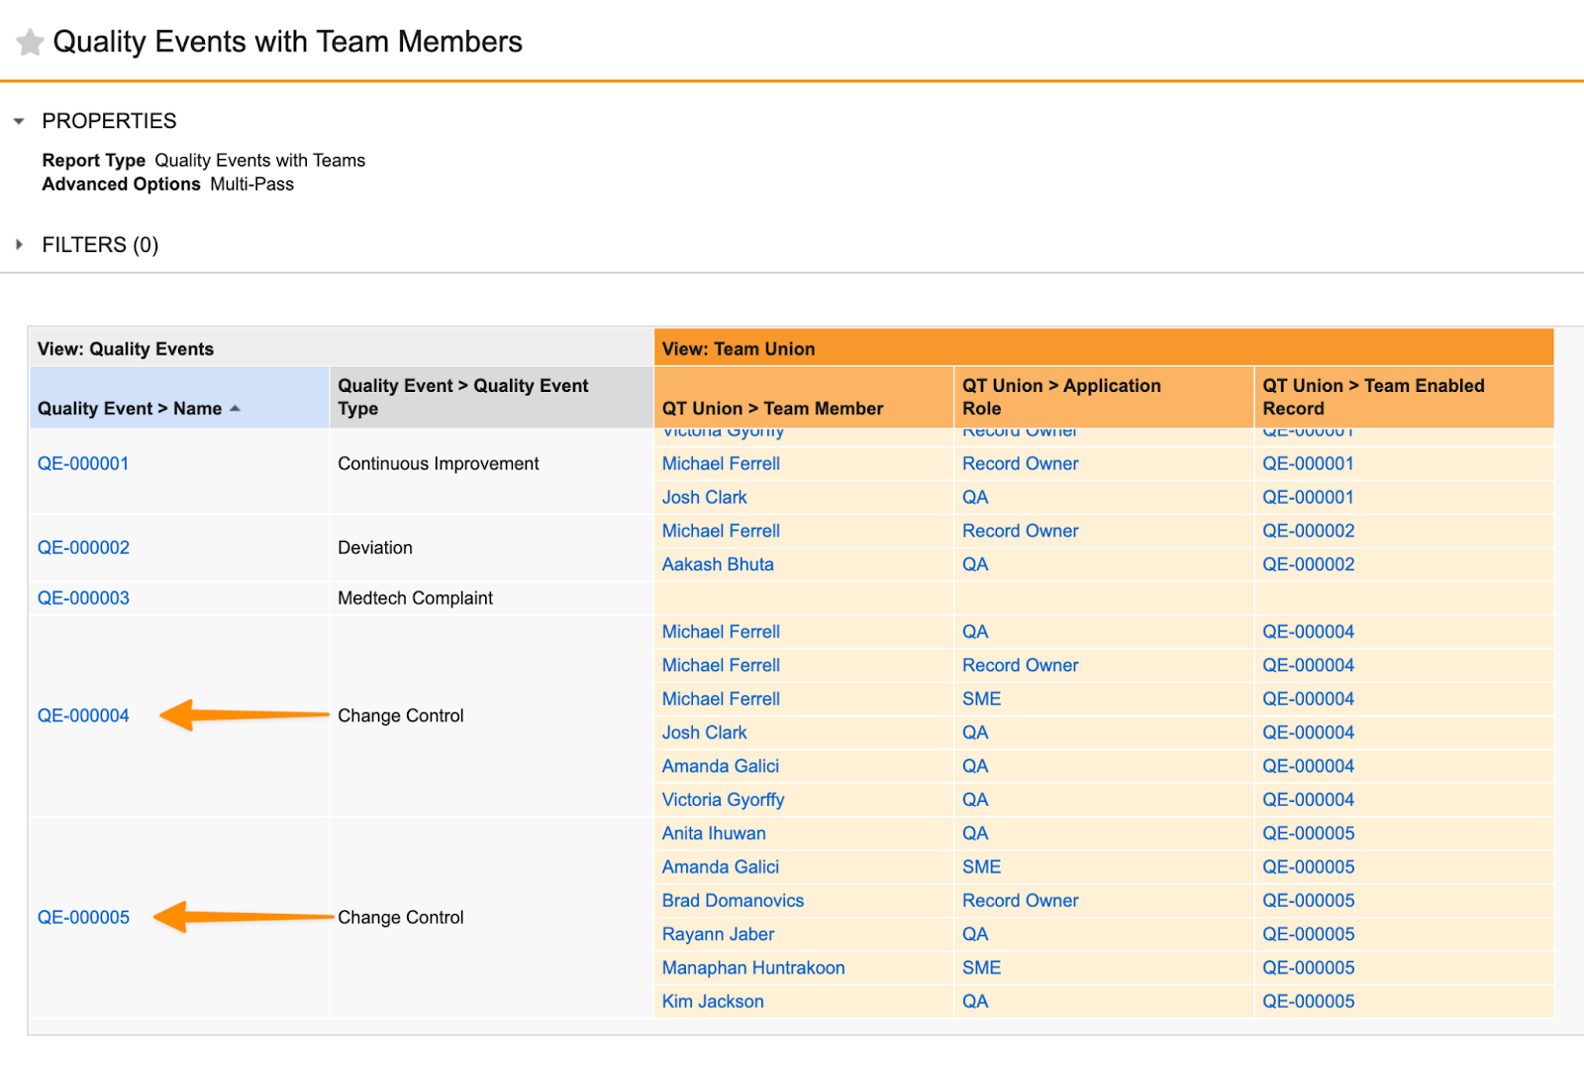
Setting the **Enable merge cells with same value** checkbox under _Advanced Options_ allows Vault to merge cells that have the same value. This is supported across all data types except _Long Text_ and _Rich Text_. For object and document references, fields are merged based on _ID_, not _Name_.

When you select the **Enable merge cells with same value** checkbox, Vault automatically selects the **Combine cells if records belong to the same report view** checkbox. With this checkbox selected, Vault merges cells with the same value only when they are associated with the same primary record in the Report View.

After enabling merge cells, click **Merge cells with same value** (<img class="inline" src="https://platform.veevavault.help/assets/images/platform_multipass_merge_cells_off.png" alt="Merged cells disabled" style=" width: 24px;" />) in each column heading in the _Report View_ in the _Filters_ section for cells you want to be merged when they have the same value. The icon changes to filled (<img class="inline" src="https://platform.veevavault.help/assets/images/platform_multipass_merge_cells_on.png" alt="Merged cells enabled" style=" width: 24px;" />) to indicate that merged cells are enabled for the column.

The following example shows merged cells in a report with _Enable merge cells with same value_ selected and _Combine cells if records belong to the same report view_ cleared:

<a href="https://platform.veevavault.help/assets/images/platform_reporting_merged_cells_01.png" data-lightbox="images" data-title="" data-alt="Example of merged cells in a report">
  <img class="docimage" src="https://platform.veevavault.help/assets/images/platform_reporting_merged_cells_01.png" alt="Example of merged cells in a report" style="width: 500px;"  />
</a>

By comparison, the following example shows merged cells in a report with both _Enable merge cells with same value_ and _Combine cells if records belong to the same report view_ selected:
<a href="https://platform.veevavault.help/assets/images/platform_reporting_merged_cells_02.png" data-lightbox="images" data-title="" data-alt="Example of merged cells in a report">
  <img class="docimage" src="https://platform.veevavault.help/assets/images/platform_reporting_merged_cells_02.png" alt="Example of merged cells in a report" style="width: 500px;"  />
</a>


<div class="note-border alert-info">
  <div class="alert alert-info" role="alert">
    <div><i class="far fa-info-circle"></i></div>
    <div class="alert-text">
      <p><strong>Note</strong>: <em>Enable merge cells with same value</em> is available for <a href="/en/lr/55007/">Multi-Pass reports</a> only.</p>
    </div>
  </div>
</div>


## Run Reports in Background {#run-in-background}

When creating or editing a report, you can choose to run the report in the background. Vault notifies you when the report results are ready to view, allowing you to continue your work while the report executes. You can click the link in the notification to access the results.

You can run a report in the background from the **Reports** page or from the report editing page. On the **Reports** page, click the **Actions** menu next to the report name and select **Run in background**. On the report editing page, click **Run** and select **Run in background**.

### Limitations

The following limitations apply to reports run in the background:

* You can run up to five (5) reports in the background at one time.
* Reports will timeout after two (2) hours.
* Results are cached for 35 days. Cached results are user-specific.
* Reports are limited to 100 columns.

 [1]: #report-type
 [2]: #tabular
 [3]: #matrix
 [5]: #formula-fields
 [6]: #advanced-options
 [7]: #actions
 [8]: #count
 [19]: #sorting
 [22]: #conditional-fields
