The Case Volume Metrics page provides visualizations of data such as the number of completed and in-progress Cases. You can modify the charts to display Case Volume Metrics as needed.
Note: The visualizations adhere to the Vault Time Zone, not the Timezone specified in your User Profile.
Access Case Volume Metrics in the Analytics tab. The location of this subtab may vary depending on your Admin’s configuration. In addition, your Admin can configure what is considered an initial, active, and completed Case. Completed Cases may include Cases and Inbox Items in terminal lifecycle states.
The Inbox Item terminal lifecycle states are as follows:
- Promoted
- Rejected
- Duplicate
- Superseded
- Inactive
The Case terminal lifecycle states are as follows:
- Closed
- Voided
- Nullified
- Inactive
- A state of the Deleted state type. Deleted state types depend on your Admin’s configuration.
Depending on your Admin’s configuration, Vault runs an hourly or daily job to provide case volume dashboard metrics. Your Admin can export an Excel or CSV file of all the (hourly or daily) job records in Business Admin > Objects > Case Volume Metrics. You can then create your own visualizations using this export.
Prerequisites
Your Admin must enable Case Volume Metrics.
Toggle Chart Data
There are three charts you can toggle to visualize Case Volume Metric data:
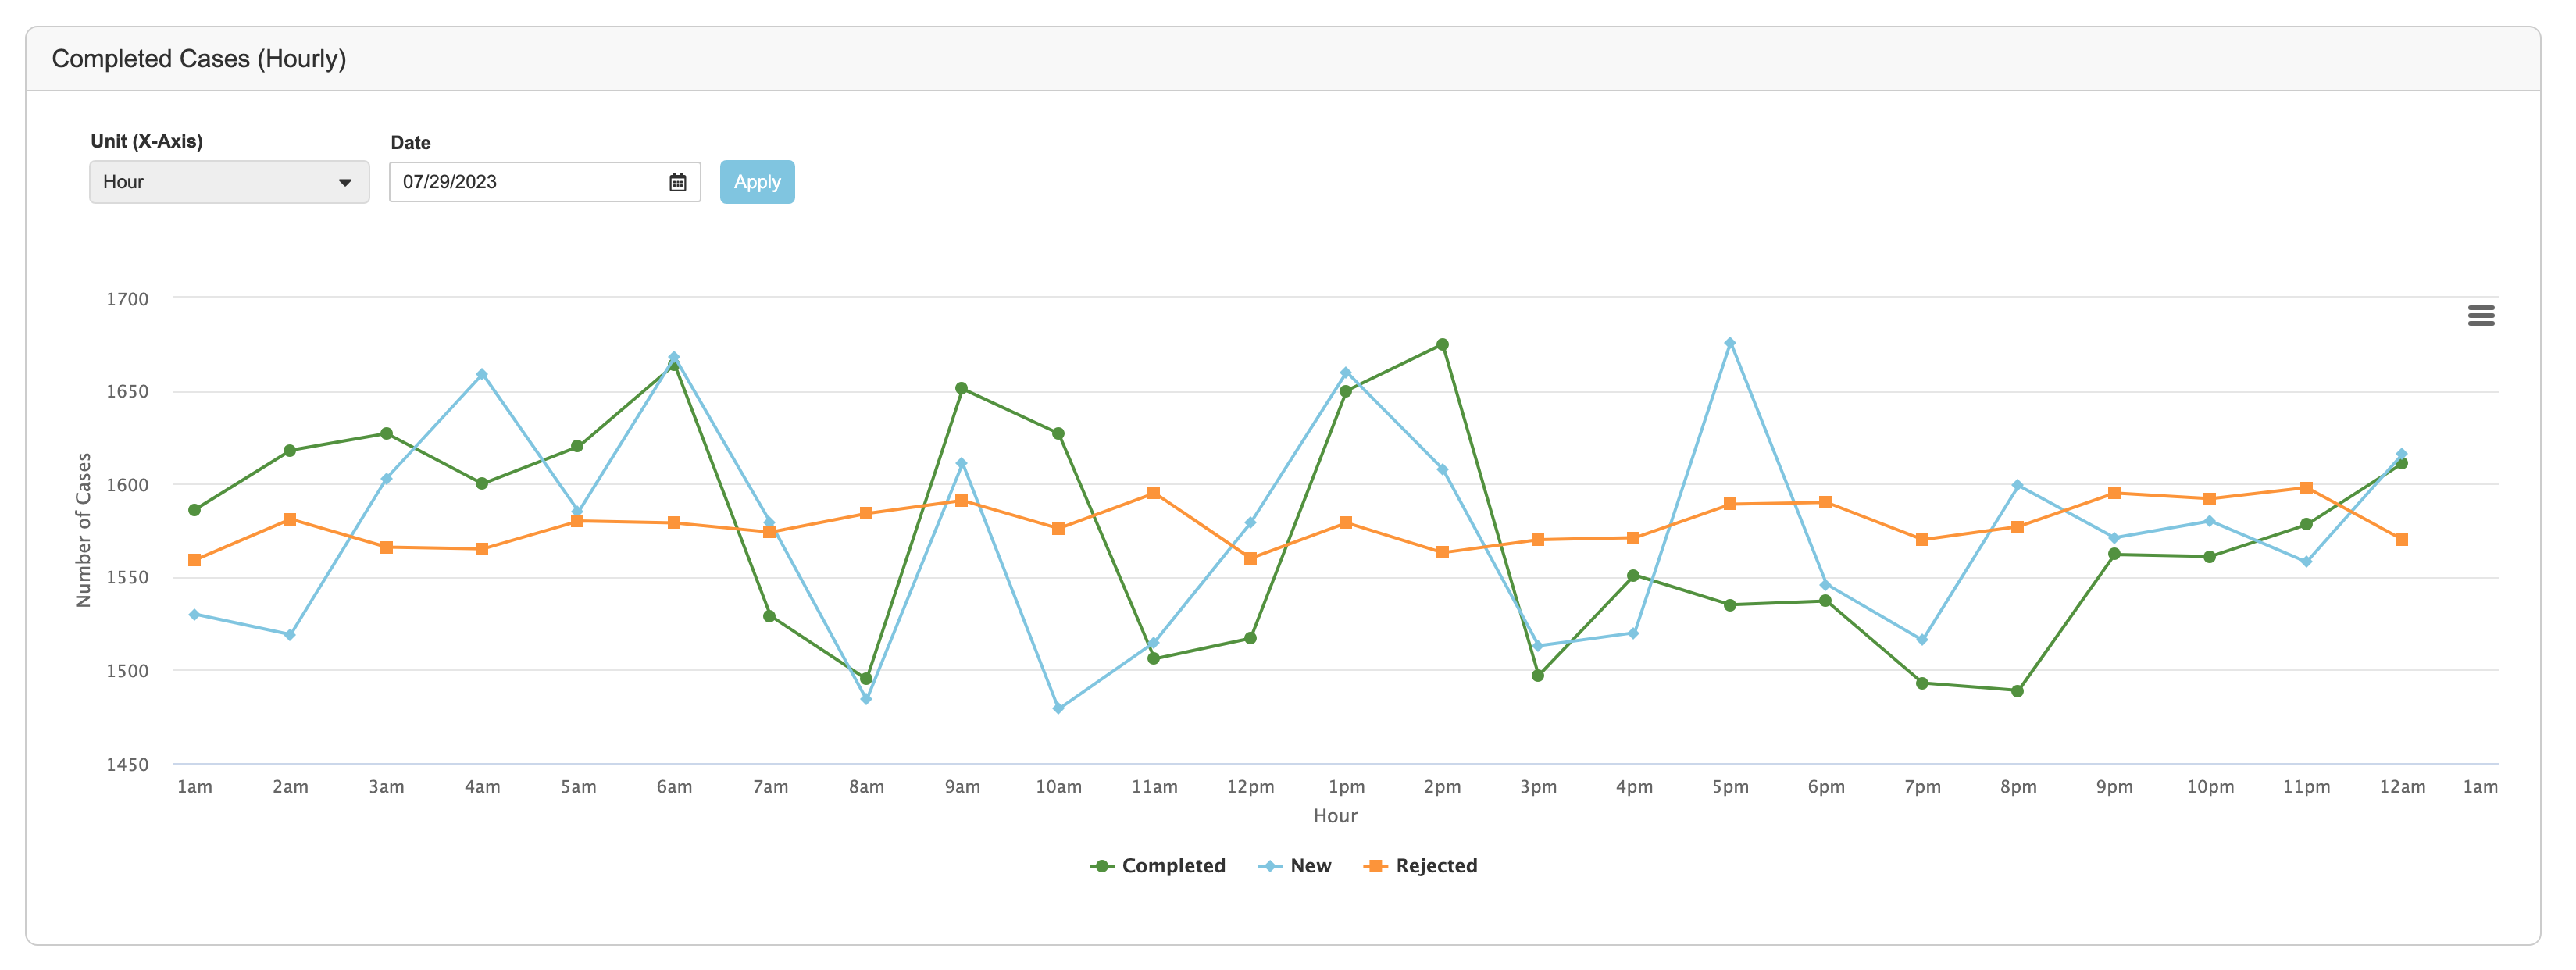
Completed Cases
In a given period of time, this chart illustrates the number of:
- Completed Cases: Cases in a lifecycle state that Vault considers as completed, which depends on your Admin’s configuration.
- New Inbox Items: Inbox Items that were created.
- Rejected Inbox Items: Inbox Items that were rejected and moved to the Rejected lifecycle state.
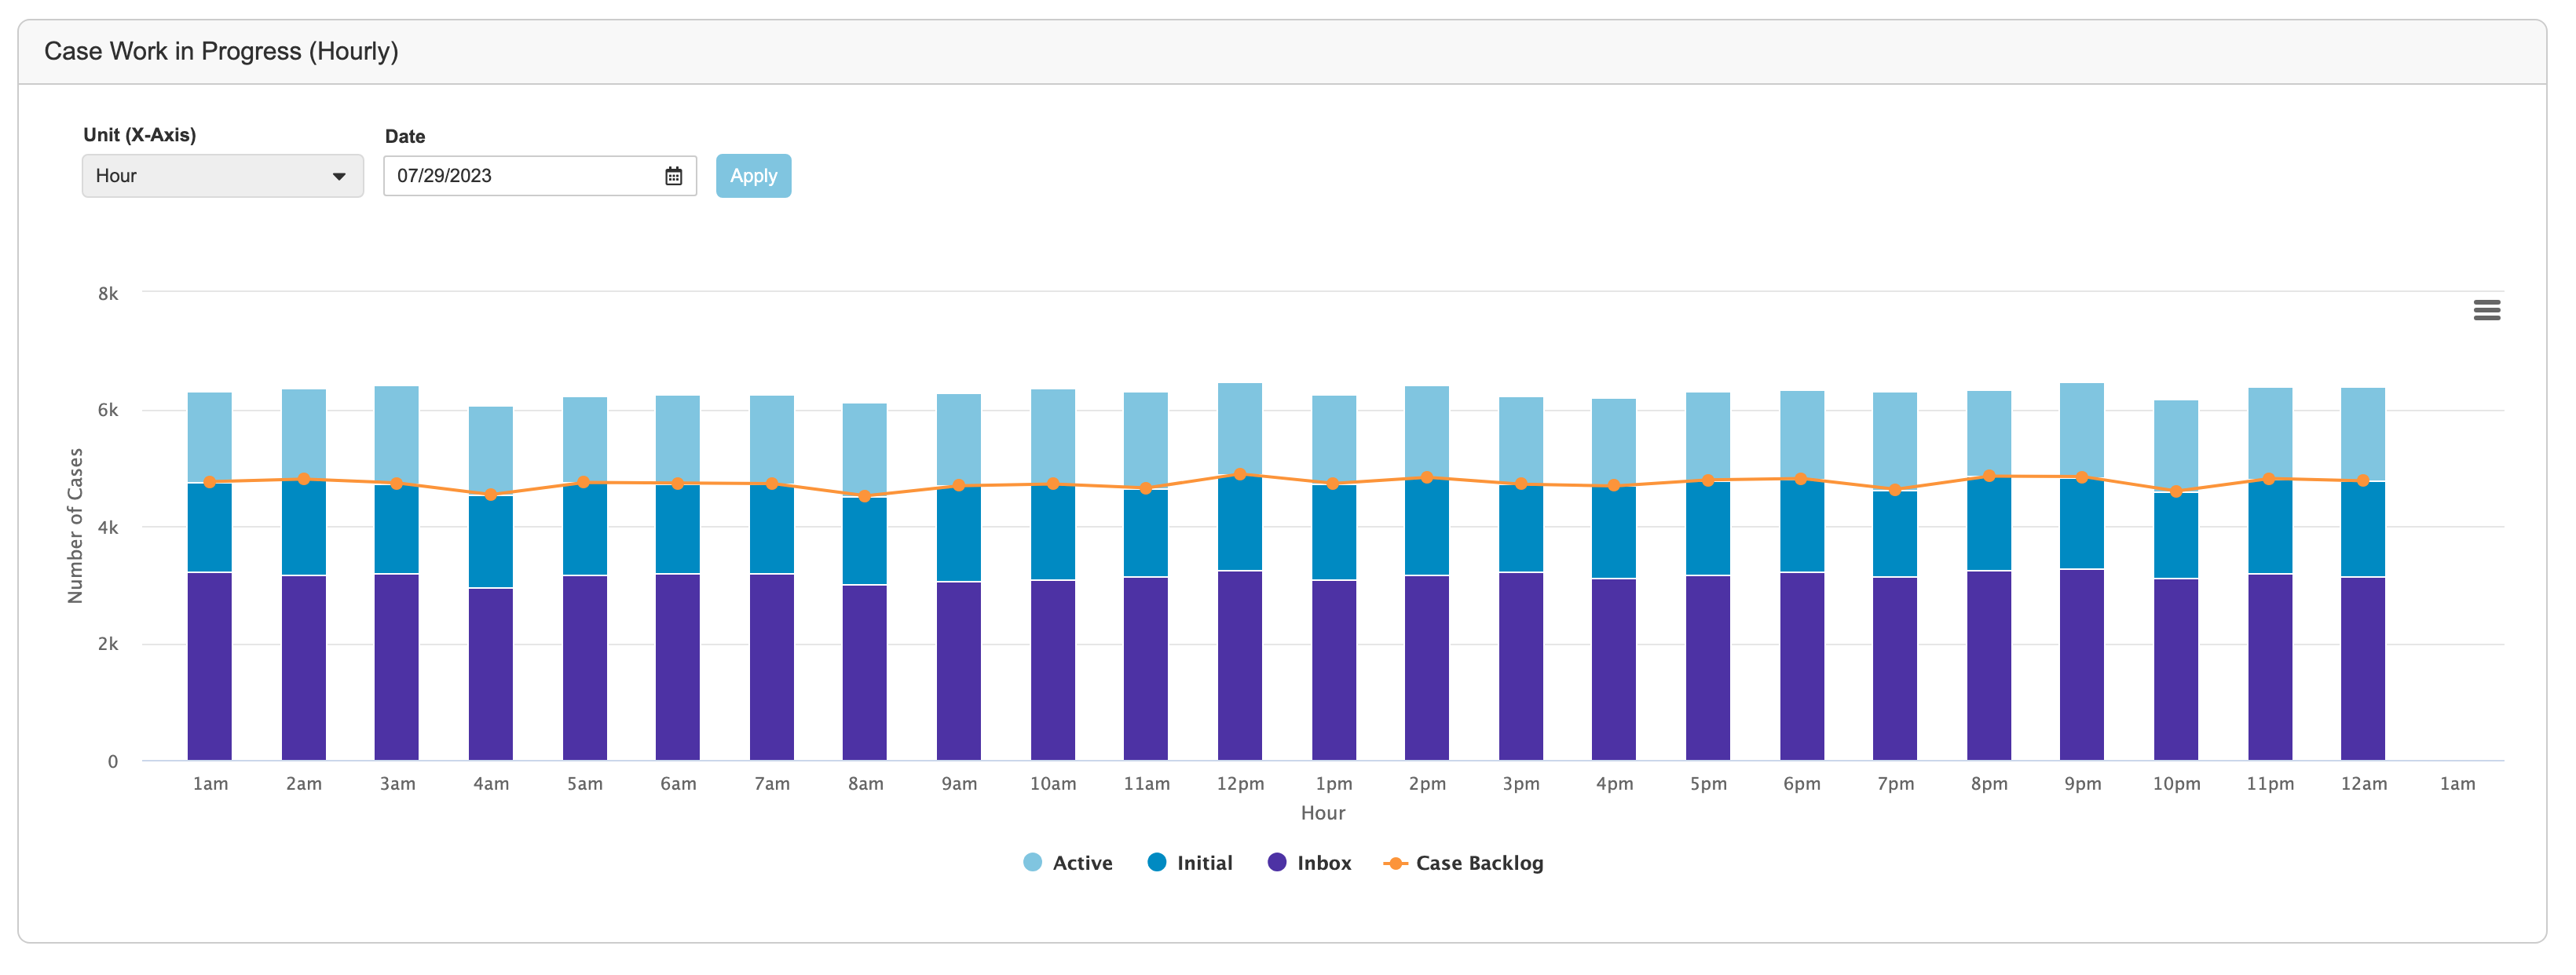
Case Work in Progress
In a given period of time, this chart illustrates the number of:
- Active Cases: Cases in a lifecycle state that Vault considers as active, which depends on your Admin’s configuration.
- Initial Cases: Cases in a lifecycle state that Vault considers as initial, which depends on your Admin’s configuration.
- Inbox Items: Inbox Items that are not in one of the following lifecycle states:
- Promoted
- Duplicate
- Rejected
- Superseded
- Cases in backlog: The sum of initial Cases and Inbox Items.
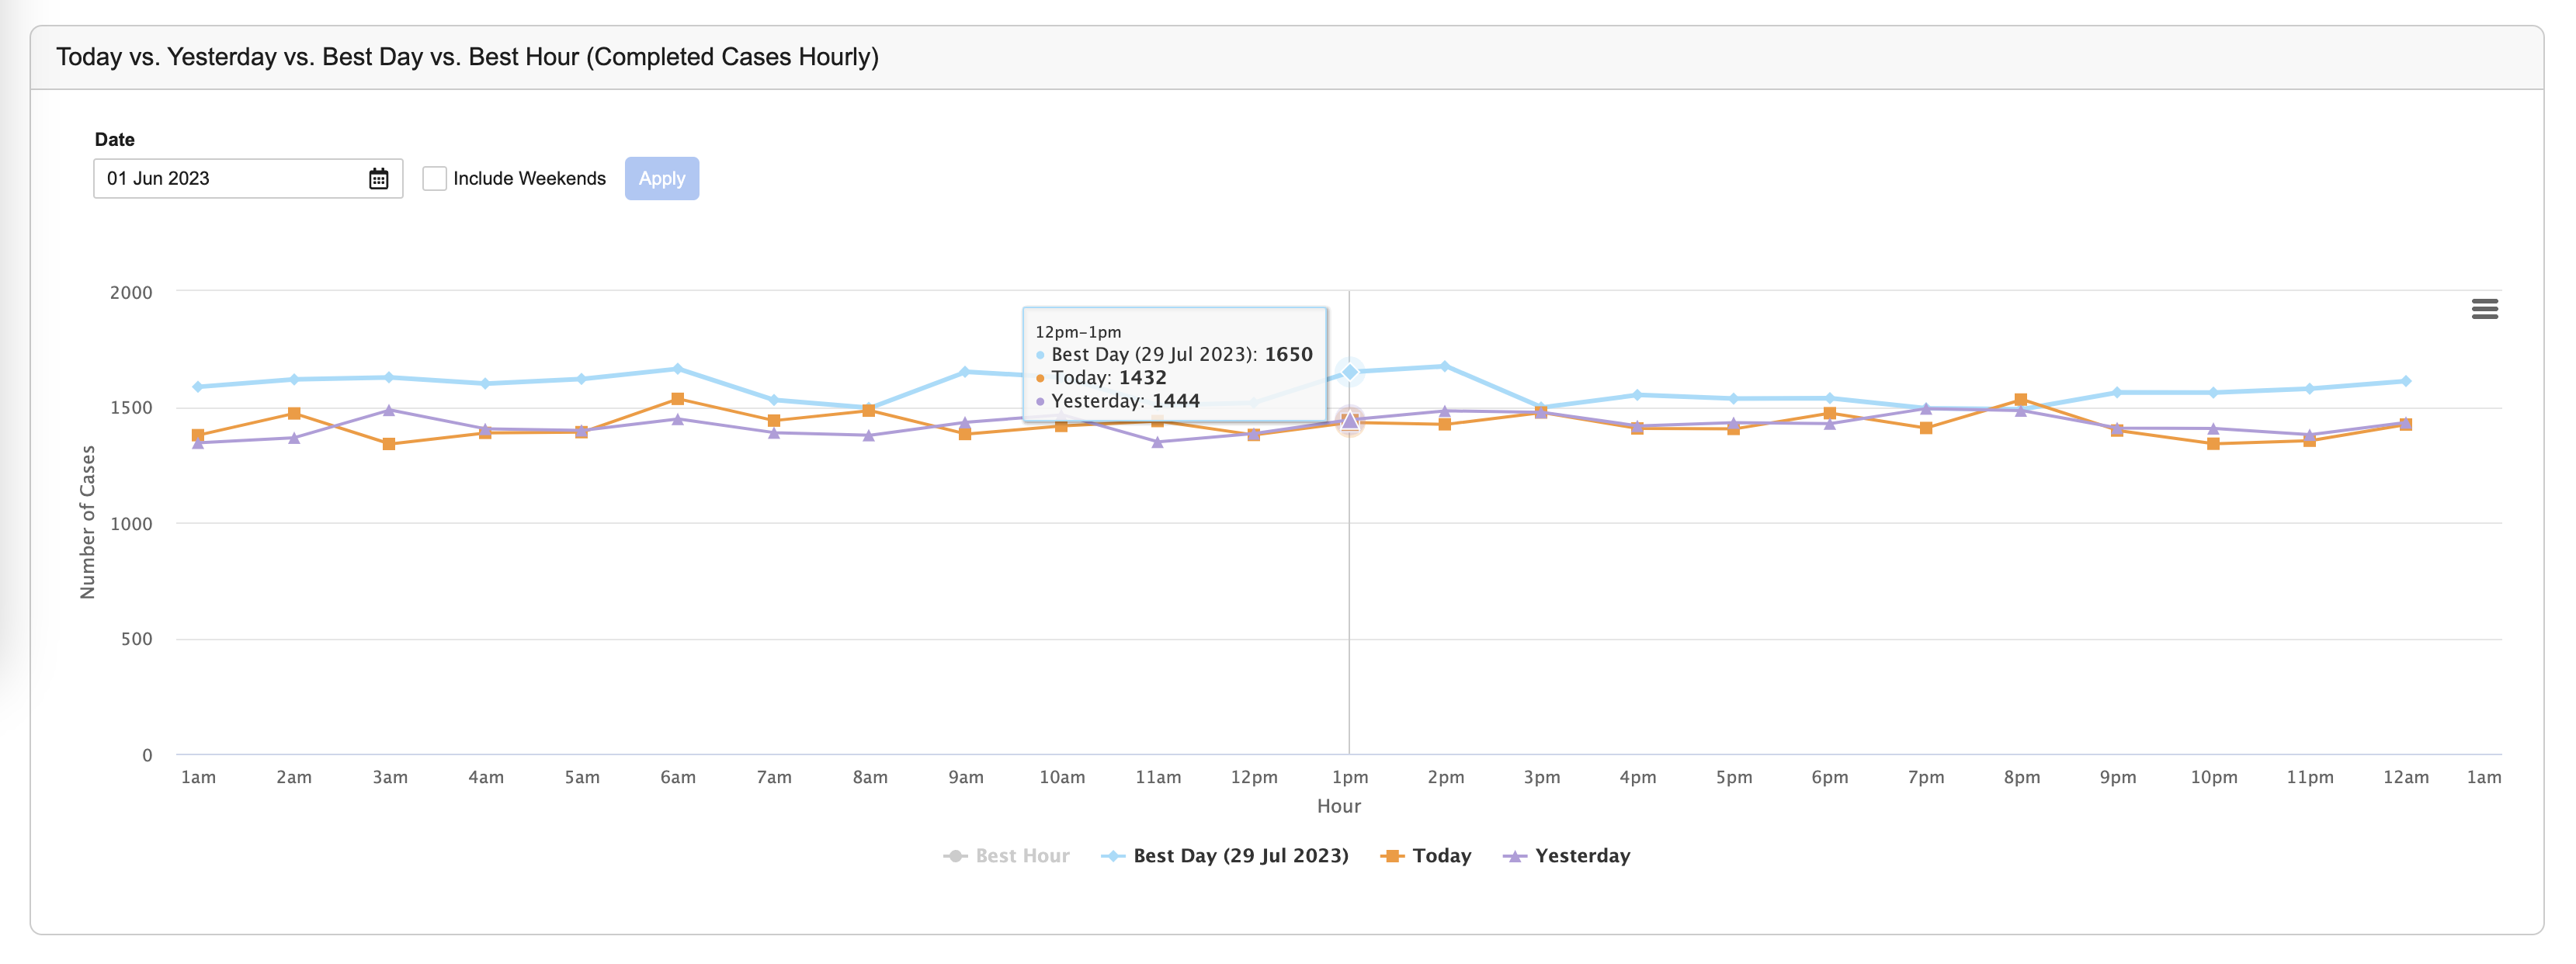
Today vs. Yesterday vs. Best Day vs. Best Hour
This chart compares the number of completed Cases for today, yesterday, the most optimal day, and the most optimal hour. These Cases are in a lifecycle state that Vault considers as completed, which depends on your Admin’s configuration.
In the Completed Cases and the Case Work in Progress charts, you can modify the Unit (X-Axis) to adjust the time measurement (for example, Day). You can then specify the dates and choose to include weekends if available.
After adjusting the chart options, select Apply to view the metrics.
Hover over the data points on the graph to display a hovercard with more information. You can also select the X-Axis legend values to remove their data from the chart.
Finally, you can use the chart menu ( ) to print or download the respective chart in your preferred format.
The job records in Business Admin include a Scheduled Datetime, which is the date and time the Case Volume Metrics job ran. When you populate a date or date range on a chart, the system uses the Scheduled Datetime to display Inbox Item and Case counts. For example, when viewing the Completed Cases chart by hour on a given day, Vault uses the hourly Scheduled Datetime values for that day to present dashboard data.


