Signal considers various calculations, disproportionality scores, and variables to identify Product-Event Combinations (PECs) of interest. This allows for the detection of new and unexpected adverse events for a medicinal product and changes to an existing PEC. To qualify as a potential signal, PECs must meet certain criteria and surpass specific thresholds. Your Admin configures the criteria and thresholds based on your organization’s business rules.
Disproportionality Reporting
Disproportionate reporting from statistical methods identifies when an event occurs more frequently than expected for a product across a single database. Disproportionate reporting uses certain variables to obtain actual and expected counts of cases.
Variables
Disproportionate reporting uses the following variables:
- A: The number of cases for a specific event (for example, event Y) occurring with a specific product (for example, product X)
- B: The number of cases for all other events occurring with product X
- C: The number of cases for event Y occurring with all other products
- D: The number of cases for all other events occurring with all other products
Adding variables together produces the following total scores:
- A + B: The total number of cases for product X
- C + D: The total number of cases for all products
- A + C: The total number of cases where event Y occurred
- B + D: The total number of cases for all other events
- A + B + C + D: The total number of cases in the given database
| Event Y | All Other Events | Total | |
|---|---|---|---|
| Product X | A | B | A + B |
| All Other Products | C | D | C + D |
| Total | A + C | B + D | A + B + C + D |
Actual and Expected Counts
Disproportionality scores are represented by actual and expected case counts of event Y occurring with product X. Actual case counts are the observed number of cases of a specific event (event Y) occurring with a specific product (product X); this score is also depicted by variable A. Expected case counts are the number of cases in which event Y is expected to occur with product X; this score is based on the overall reporting rate of adverse events occurring for product X and across all products. The following formula represents the expected probability: (A + B) * (A + C) / (A + B + C + D).
Case Counts
Vault counts the number of postmarket Cases that are spontaneous, fatal, and serious for the related PEC.
For more details on Case counts, see Create Statistical Data.
Listedness
From the Case Assessment level Listedness (Core) field, Vault determines an event is Unlisted for the Product if at least one (1) Case Assessment is evaluated as Unlisted or there is no evaluation (Listedness (Core) is blank). To consider a PEC as Listed, all Case Assessments for that PEC must be evaluated as Listed.
Empirical Bayes Geometric Mean (EBGM)
The Empirical Bayes Geometric Mean (EBGM) is an advanced statistical method for measuring how frequently an adverse event and Product of interest occur together in unique Cases (for distinct patients). The EBGM uses the Bayesian shrinkage model, meaning it shrinks the estimated case counts for rare PECs to provide a more stable and reliable estimate.
The EBGM calculation offers a high degree of confidence even among smaller sample sizes. EBGM scores are supplemented by the EB05 and EB95, the lower and upper 90% confidence limits.
EB05 and EB95 Scores
EB05 and EB95 scores are used as lower and upper confidence bounds, respectively, for the EBGM 90% confidence interval. The confidence interval outlines the uncertainty in a PEC estimate to address small sample sizes.
EB05 represents the lower bound of the EBGM score and indicates there is a 5% probability the true value of the EBGM score is lower than the calculated value.
EB95 represents the upper bound of the EBGM score, and indicates there is a 5% probability the true value of the EBGM score is greater than the calculated value.
Information Component
The Information Component (IC) is an advanced disproportionality statistical method that incorporates EBGM’s Bayesian shrinkage model. The IC statistical method is stricter than the EBGM and offers even higher confidence when identifying PECs in small sample sizes. The IC calculation scores are:
- IC: The raw information component (without the Bayesian shrinkage model)
- IC-Bayes: The Bayesian shrinkage-adjusted information component
- IC025 and IC005 quantile calculations: The lower confidence limits supplementing the information component
A higher positive score indicates the PEC was reported more frequently than expected, suggesting a stronger product-event association, whereas a negative score indicates the PEC was reported less frequently than expected.
IC025 and IC005 Scores
IC025 and IC005 scores are the lower confidence bounds for the 95% and 99% IC confidence intervals, respectively. IC025 indicates there is a 5% probability the true value of the IC score is lower than the calculated value, while IC005 indicates a 1% probability. Scores suggest a PEC is disproportionately reported if:
- IC025 > 0 on a full dataset (unfiltered and unstratified)
- IC005 > 0 on a filtered or stratified dataset (for example, by age group)
Stratification
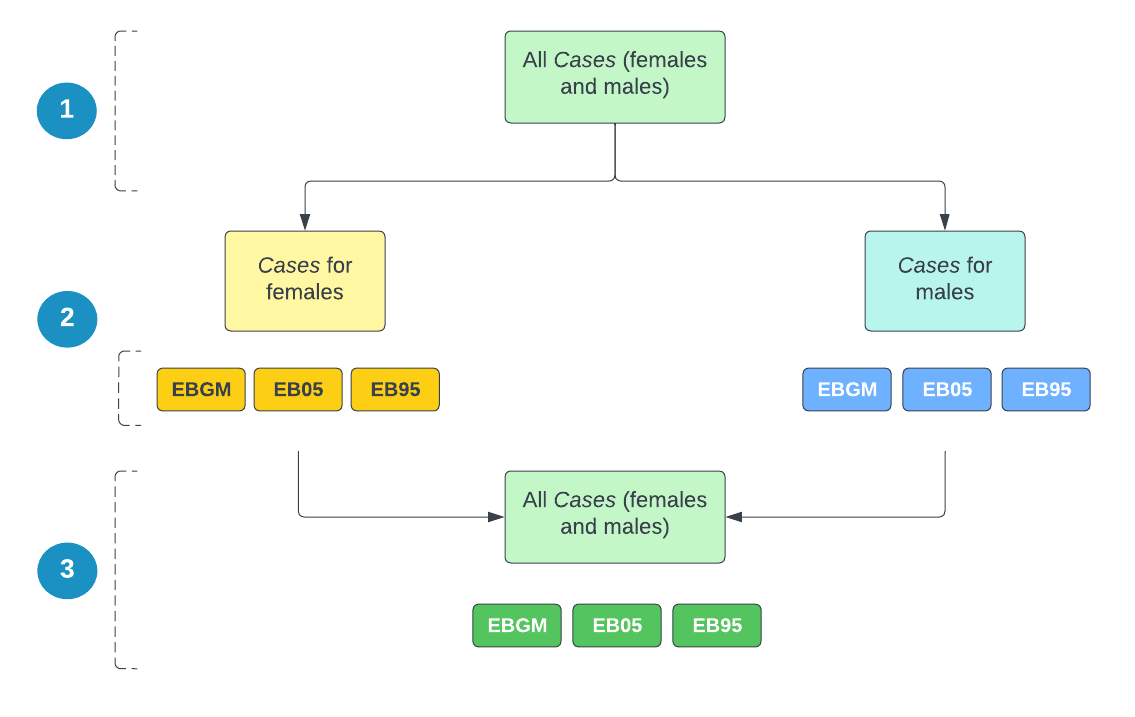
Stratification is a method for normalizing data to eliminate confounding variables that can influence the probability of experiencing an adverse event when taking a given product. For example, to eliminate the potential confounding effects of gender, the stratification method studies the data for each gender and then pools the scores together.
The following diagram demonstrates an example of how Safety Signal stratifies data by gender: