In addition to standard regulatory aggregate reports, Safety also provides a frequency analysis report to help identify adverse event trends across large case volumes and customizable timeframes. Vault generates the following frequency analysis tabulations by default, each providing support for masking:
- Summary Tabulation of Events by Period and Product
- Summary Tabulation of Events by Expectedness and Product
- Summary Tabulation of Events by Case Category and Product
- Summary Tabulation of Events by Seriousness and Product
- Summary Tabulation of Events by Relatedness and Product
- Interval Line Listing of Events
Prerequisites
To generate frequency analysis tabulations and lines:
- You must be assigned permissions to view and prepare aggregate reports. Typically, these permissions are reserved for the Safety Writer and Head of Safety roles.
- The Reporting Family must contain the Products, Studies, and Substances to include in the Frequency Analysis report.
- To add a tab at the beginning of the aggregate report document detailing the criteria used to generate the report, your Admin must enable the Criteria Page for Aggregate Reports.
- To use custom report templates, your Admin must configure report templates for each applicable Frequency Analysis report.
Create a Frequency Analysis Report
To create a Frequency Analysis report:
- Navigate to Aggregate Reports > Frequency Analysis.
- Select Create.
- Complete the applicable fields.
- Select Save.
The Frequency Analysis report enters the Pending state. Vault assigns a task to users in the Safety Writer role to review the report details.
Frequency Analysis Report Fields
The following fields may be available:
| Field | Description |
|---|---|
| Product Family |
Select the Reporting Family of type Product Family configured for aggregate reporting. The Reporting Family defines the Cases Vault includes in the report, considering all Cases with:
|
| Organization |
Vault populates the Organization on the selected Reporting Family. |
| Filter Case By |
To customize how Vault filters Cases within the specified date range, select an option:
If this field is blank, Vault uses the Case Receipt Date/New Info Date. |
| Filter by Country |
Select one or more countries to restrict report data to specific health authorities. Leave blank to include Cases from all countries. If populated, Vault includes Cases where at least one of the following matches your selections:
|
| Data Period Start |
Enter the data period start date of Period 1. |
| Data Period End |
Enter the data period end date of Period 1. |
| States to Include |
Select the states that Cases must be in to be included in the report. Vault excludes Cases in the Nullified or Voided state. |
| Seriousness |
Select one or more Seriousness values to filter the Case Adverse Events included in the report. Vault excludes Cases related to Case Adverse Events that do not match your selection, even if another event on the same Case matches. |
| Include Invalid Cases |
Select this checkbox to include Cases in the Invalid lifecycle state, or that have the Invalid Reason field populated, regardless of whether the Case is suppressed. If you do not select this checkbox, Vault excludes invalid Cases, as well as valid Cases that are suppressed. |
| Drug Roles to Include |
Select one or more Drug Roles to include in the report. |
| Generate Masked Documents |
Select this option to generate a masked copy of the Frequency Analysis report document, in addition to the unmasked copy, when at least one blinded Study is associated with the Reporting Family. On a masked tabulation, Vault adds an additional Blinded product row that counts events on blinded Cases and Products. On a masked line listing, Vault displays Blinded for the Product Name on blinded Study Products, regardless of whether the individual Case is blinded or unblinded. To learn more, see Generate Masked Aggregate Tabulations (CIOMS II, PBRER and DSUR). |
| Include Criteria Page on Documents |
Select the checkbox to add a tab at the beginning of the generated report file detailing the filters used to generate the report, including the dates specified for each configured reporting period. If the report masks blinded information, the criteria page also indicates which details are blinded. |
Reporting Periods
Vault generates up to three Aggregate Report Intervals associated with the Frequency Analysis report. Each Aggregate Report Interval has an Interval Start Date and Interval End Date which define the date range for that period.
- Period 1: Vault uses the Data Period Start and Data Period End values on the Frequency Analysis report to populate the Interval Start Date and Interval End Date on the Interval 1 record in the Aggregate Report Intervals section. Vault keeps these values in sync: updating the Data Period Start or Data Period End on the Frequency Analysis report updates the Interval Start Date or Interval End Date on Interval 1, and updating the Interval Start Date or Interval End Date on Interval 1 updates the Data Period Start or Data Period End on the Frequency Analysis report.
- Period 2 and Period 3: After you save the Frequency Analysis report, Vault adds blank Interval 2 and Interval 3 records to the report’s Aggregate Report Intervals section. Populate their Interval Start Date and Interval End Date fields to activate Period 2 and Period 3 on the report.
Vault displays Period columns only for the Aggregate Report Intervals you populate. As such, if you leave Interval 2 and Interval 3 blank, Vault omits the Period 2 and Period 3 columns from the report.
Generate Frequency Analysis Report Tabulations
Review and verify the report settings. Once you have confirmed the report details are correct, use the Generate Aggregate Report Tabulations action to generate Frequency Analysis report tabulations.
Frequency Analysis Report Table Generation Data Mapping
Vault populates aggregate report tabulations using Cases within the reporting period specified on the Frequency Analysis report, and the reporting family members configured on the associated Reporting Family. In each summary tabulation, Vault sorts rows alphabetically, first by Product, then by MedDRA Preferred Term (PT), with grand total rows displayed last. The number of Period columns shown on a tabulation matches the number of reporting intervals configured on the Frequency Analysis report.
Note: For blinded Studies, Vault populates blinded Product information as Blinded in the generated tabulations. If the Blinded Placeholder Name field is populated, Vault populates this name on the report instead of the generic Blinded label.
Inclusion Criteria for Frequency Analysis Reports
Vault considers the following criteria when assessing Cases for inclusion in Frequency Analysis reports:
Product or Study Product in Reporting Family
A Case must have a Case Product that meets either of the following conditions:
-
The Case Product is a member of the Reporting Family, or has a Product Substance that is a member of the Reporting Family.
case_version__vr.case_product__v.product__v IN
aggregate_report_family__vr.aggregate_report_family_join__vr.products__v -
The Case Product has a Product Substance that is a member of the Reporting Family.
reporting_family_v.substance__v.substance_v ≠ BLANK
AND reporting_family_v.substance__v.substance_v =
case_product__v.product__v.product_substance__v
If the Frequency Analysis report incorrectly includes a Case due to the Product or Study changing between Case versions, your Admin can enable the Consider Reporting Family after Latest Version feature so that Vault applies the Reporting Family filter after determining the latest Case version. Enabling this feature has a performance impact.
If required, your Admin can enable the Consider Reporting Family after Latest Version feature which controls whether the Reporting Family filter is applied before or after determining the latest Case version. Enabling this feature impacts report performance.
Note: Vault applies the same blinded and unblinded Study Product handling used for PBRER reports when determining Reporting Family membership.
Country Filter
If the Frequency Analysis report contains one or more values in the Filter by Country field, Vault includes Cases for each Country that matches at least one of the following criteria:
- An Event Country on any related Case Adverse Event
- The Reporter Country on the Case
If the Filter by Country field is blank, Vault includes Cases for all Countries.
Seriousness Filter
Vault filters individual Case Adverse Events by the Seriousness value selected on the report.
Case Data in Cumulative Reporting Period
The date must be within the Frequency Analysis report cumulative reporting period. How Aggregate Reports Filter by Data Period provides more information.
DATE ≤ dsur__v.data_period_end__v
where DATE depends on the option selected in the Filter Case By (dsur__v.filter_cases_by__v) field:
- When blank or Case Receipt Date / New Info Date (Default):
- If the Case New Info Date (
new_info_date__v) is blank, Vault uses the Receipt Date:case_version__v.receipt_date__v - Otherwise, Vault uses the New Info Date:
case_version__v.new_info_date__v
- If the Case New Info Date (
- When Case Approval Date:
case_version__v.approval_date__v
If the Case has multiple versions within the reporting period, Vault lists only the most recent Case version within the reporting period.
Case Lifecycle State in Aggregate States to Include
The latest Case version within the reporting period must be in a state specified in the States to Include field on the Frequency Analysis report.
case_version__v.state__v CONTAINS dsur__v.states_to_include__v
Vault omits Cases in the following states:
- Nullified (
nullified_state__v) - Voided (
voided_state__v)
Note: You cannot select these states in the States to Include field. These states are always omitted.
Invalid Cases Filter
If Include Invalid Cases is selected (the default), Vault includes Cases with the following:
- A lifecycle state of Invalid
- An Invalid Reason value
- A Suppress Submission of Yes
Case Product in Drug Roles to Include
Vault includes Case Products where the Drug Role matches one of the Drug Roles specified on the Drug Roles to Include field on the Frequency Analysis report.
case_product__v.drug_role__v CONTAINS frequency_analysis__v.drug_roles_to_include__v
Summary Tabulation of Events by Period and Product
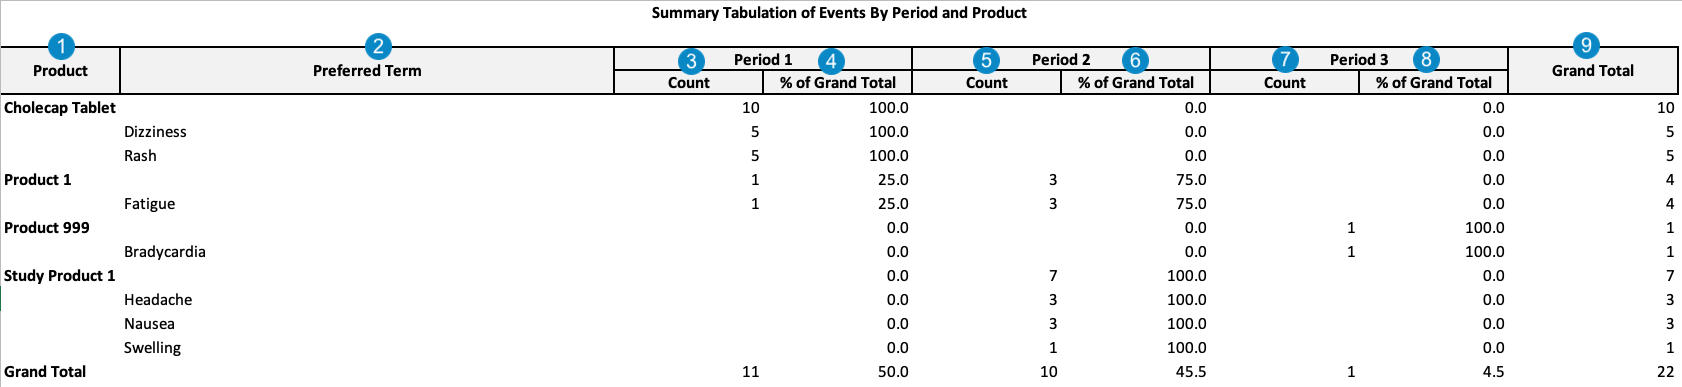
Table Mapping
| Number | Name | Description |
|---|---|---|
 |
Product | The Product associated with the Case Adverse Events in the row. If the Product is part of a blinded Study and the report masks blinded information, Vault displays Blinded instead of the Product name. |
 |
Preferred Term | Vault maps the MedDRA Preferred Term (PT) for the event. If the PT Aggregation in Periodic Reports feature is enabled in your Vault, Vault counts multiple LLTs on the same Case that map to the same PT only once. |
 |
Count (Period 1) | Vault totals the number of events for the Product and PT that fall within the dates specified in Interval 1. |
 |
% of Grand Total | Vault maps the Count (Period 1) for the Product and PT, divided by the Grand Total. |
 |
Count (Period 2) | Vault totals the number of events for the Product and PT that fall within the dates specified in Interval 2. |
 |
% of Grand Total | Vault maps the Count (Period 2) for the Product and PT, divided by the Grand Total. |
 |
Count (Period 3) | Vault totals the number of events for the Product and PT that fall within the dates specified in Interval 3. |
 |
% of Grand Total | Vault maps the Count (Period 3) for the Product and PT, divided by the Grand Total. |
 |
Grand Total | Vault maps the total number of events for the Product and PT across all configured reporting periods. |
Summary Tabulation of Events by Expectedness and Product

Table Mapping
| Number | Name | Description |
|---|---|---|
|
Product | The Product associated with the events in the row. If the Product is part of a blinded study and the report masks blinded information, Vault displays Blinded instead of the Product name. |
|
Preferred Term | Vault maps the MedDRA Preferred Term (PT) for the event. If the PT Aggregation in Periodic Reports feature is enabled in your Vault, Vault counts multiple LLTs on the same Case that map to the same PT only once. |
|
Period 1 (Expected) | Vault totals the number of Expected events for the Product and PT that fall within the dates specified in Interval 1. |
|
Period 2 (Expected) | Vault totals the number of Expected events for the Product and PT that fall within the dates specified in Interval 2. |
|
Period 3 (Expected) | Vault totals the number of Expected events for the Product and PT that fall within the dates specified in Interval 3. |
|
Total (Expected) | Vault maps the sum of Period 1, Period 2, and Period 3 Expected counts for the Product and PT. |
|
% of Grand Total (Expected) | Vault maps the Total (Expected) for the Product and PT, divided by the Grand Total. |
|
Period 1 (Unexpected) | Vault totals the number of Unexpected events for the Product and PT that fall within the dates specified in Interval 1. |
|
Period 2 (Unexpected) | Vault totals the number of Unexpected events for the Product and PT that fall within the dates specified in Interval 2. |
 |
Period 3 (Unexpected) | Vault totals the number of Unexpected events for the Product and PT that fall within the dates specified in Interval 3. |
 |
Total (Unexpected) | Vault totals the sum of Period 1, Period 2, and Period 3 Unexpected counts for the Product and PT. |
 |
% of Grand Total (Unexpected) | Vault maps the Total (Unexpected) for the Product and PT, divided by the Grand Total. |
 |
Grand Total | Vault maps the total number of Expected and Unexpected events for the Product and PT across all configured reporting periods. |
Summary Tabulation of Events by Case Category and Product

Table Mapping
| Number | Name | Description |
|---|---|---|
|
Product | The Product associated with the events in the row. If the Product is part of a blinded study and the report masks blinded information, Vault displays Blinded instead of the Product name. |
|
Preferred Term | Vault maps the MedDRA Preferred Term (PT) for the event. If the PT Aggregation in Periodic Reports feature is enabled in your Vault, Vault counts multiple LLTs on the same Case that map to the same PT only once. |
|
Period 1 (Interventional) | Vault totals the number of Interventional events for the Product and PT that fall within the dates specified in Interval 1. |
|
Period 2 (Interventional) | Vault totals the number of Interventional events for the Product and PT that fall within the dates specified in Interval 2. |
|
Period 3 (Interventional) | Vault totals the number of Interventional events for the Product and PT that fall within the dates specified in Interval 3. |
|
Total (Interventional) | The sum of Period 1, Period 2, and Period 3 Interventional counts for the Product and PT. |
|
% of Grand Total (Interventional) | The Interventional Total for the Product and PT, divided by the Grand Total. |
|
Period 1 (Non-Interventional) | Vault totals the number of Non-Interventional events for the Product and PT that fall within the dates specified in Interval 1. |
|
Period 2 (Non-Interventional) | Vault totals the number of Non-Interventional events for the Product and PT that fall within the dates specified in Interval 2. |
|
Period 3 (Non-Interventional) | Vault totals the number of Non-Interventional events for the Product and PT that fall within the dates specified in Interval 3. |
|
Total (Non-Interventional) | Vault maps the sum of Period 1, Period 2, and Period 3 Non-Interventional counts for the Product and PT. |
|
% of Grand Total (Non-Interventional) | The Non-Interventional Total for the Product and PT, divided by the Grand Total. |
|
Period 1 (Spontaneous) | Vault totals the number of Spontaneous events for the Product and PT that fall within the dates specified in Interval 1. |
 |
Period 2 (Spontaneous) | Vault totals the number of Spontaneous events for the Product and PT that fall within the dates specified in Interval 2. |
 |
Period 3 (Spontaneous) | Vault totals the number of Spontaneous events for the Product and PT that fall within the dates specified in Interval 3. |
 |
Total (Spontaneous) | Vault totals the sum of Period 1, Period 2, and Period 3 Spontaneous counts for the Product and PT. |
 |
% of Grand Total (Spontaneous) | Vault maps the Spontaneous Total for the Product and PT, divided by the Grand Total. |
 |
Grand Total | Vault maps the total number of Interventional, Non-Interventional, and Spontaneous events for the Product and PT across all configured reporting periods. |
Summary Tabulation of Events by Seriousness and Product

Table Mapping
| Number | Name | Description |
|---|---|---|
|
Product | The Product associated with the events in the row. If the Product is part of a blinded study and the report masks blinded information, Vault displays Blinded instead of the Product name. |
|
Preferred Term | Vault maps the MedDRA Preferred Term (PT) for the event. If the PT Aggregation in Periodic Reports feature is enabled in your Vault, Vault counts multiple LLTs on the same Case that map to the same PT only once. |
|
Period 1 (Serious) | Vault totals the number of Serious events for the Product and PT that fall within the dates specified in Interval 1. |
|
Period 2 (Serious) | Vault totals the number of Serious events for the Product and PT that fall within the dates specified in Interval 2. |
|
Period 3 (Serious) | Vault totals the number of Serious events for the Product and PT that fall within the dates specified in Interval 3. |
|
Total (Serious) | Vault maps the sum of Period 1, Period 2, and Period 3 Serious counts for the Product and PT. |
|
% of Grand Total (Serious) | Vault maps the Serious Total for the Product and PT, divided by the Grand Total. |
|
Period 1 (Non-Serious) | Vault totals the number of Non-Serious events for the Product and PT that fall within the dates specified in Interval 1. |
|
Period 2 (Non-Serious) | Vault totals the number of Non-Serious events for the Product and PT that fall within the dates specified in Interval 2. |
|
Period 3 (Non-Serious) | Vault totals the number of Non-Serious events for the Product and PT that fall within the dates specified in Interval 3. |
|
Total (Non-Serious) | Vault maps the sum of Period 1, Period 2, and Period 3 Non-Serious counts for the Product and PT. |
|
% of Grand Total (Non-Serious) | Vault maps the Non-Serious Total for the Product and PT, divided by the Grand Total. |
|
Grand Total | Vault maps the total number of Serious and Non-Serious events for the Product and PT across all configured reporting periods. |
Summary Tabulation of Events by Relatedness and Product

Table Mapping
| Number | Name | Description |
|---|---|---|
|
Product | The Product associated with the events in the row. If the Product is part of a blinded study and the report masks blinded information, Vault displays Blinded instead of the Product name. |
|
Preferred Term | Vault maps the MedDRA Preferred Term (PT) for the event. If the PT Aggregation in Periodic Reports feature is enabled in your Vault, Vault counts multiple LLTs on the same Case that map to the same PT only once. |
|
Period 1 (Related) | Vault totals the number of Related events for the Product and PT that fall within the dates specified in Interval 1. |
|
Period 2 (Related) | Vault totals the number of Related events for the Product and PT that fall within the dates specified in Interval 2. |
|
Period 3 (Related) | Vault totals the number of Related events for the Product and PT that fall within the dates specified in Interval 3. |
|
Total (Related) | Vault maps the sum of Period 1, Period 2, and Period 3 Related counts for the Product and PT. |
|
% of Grand Total (Related) | Vault maps the Related Total for the Product and PT, divided by the Grand Total. |
|
Period 1 (Non-Related) | Vault totals the number of Non-Related events for the Product and PT that fall within the dates specified in Interval 1. |
|
Period 2 (Non-Related) | Vault totals the number of Non-Related events for the Product and PT that fall within the dates specified in Interval 2. |
|
Period 3 (Non-Related) | Vault totals the number of Non-Related events for the Product and PT that fall within the dates specified in Interval 3. |
|
Total (Non-Related) | Vault maps the sum of Period 1, Period 2, and Period 3 Non-Related counts for the Product and PT. |
|
% of Grand Total (Non-Related) | Vault maps the Non-Related Total for the Product and PT, divided by the Grand Total. |
|
Grand Total | Vault maps the total number of Related and Non-Related events for the Product and PT across all configured reporting periods. |
Interval Line Listing of Events

Table Mapping
| Number | Name | Description |
|---|---|---|
|
Case Name |
The Name of the Case, displayed as a link to the Case in Vault.
|
|
Period |
The reporting interval (1, 2, or 3) the event falls within, based on the Interval Start Date and Interval End Date configured on the report. |
|
Date |
The Case Approval Date or the Case Receipt Date/New Info Date, depending on the Filter Case By value on the Frequency Analysis report. If using Receipt Date/New Info Date, Vault uses the New Info Date if populated; otherwise, it uses the Receipt Date.
|
|
Case Category |
Vault populates
|
|
Reporter Country |
Vault maps the Reporter Country from the Case. If this field is blank, Vault displays
|
|
Event Country |
Vault maps the Event Country from the Case Adverse Event. If this field is blank, Vault displays
|
|
Product Name |
Vault maps the Product name from Case Product. If the Product is blinded, Vault displays
|
|
SOC |
Vault maps the MedDRA System Organ Class (SOC) on the Case Adverse Event. If this field is blank, Vault displays
|
|
Preferred Term |
Vault maps the MedDRA Preferred Term (PT) on the Case Adverse Event. If this field is blank, Vault displays
|
|
Serious (Case Level) |
Vault maps the Serious value on the Case.
|
|
Seriousness |
Vault maps the Seriousness value on the Case Adverse Event. If this field is blank, Vault displays
|
|
Relatedness |
Whether the Case Adverse Event is related to the Product, based on DSUR relatedness logic applied to the Case Assessments. If no assessment is available, Vault assumes the event is related. |
|
Case Expectedness |
Vault maps the Expected value on the Case Assessment for the Case Adverse Event.
|
|
Lifecycle State |
Vault maps the Lifecycle State on the Case.
|
|
Invalid Reason |
Vault maps the Invalid Reason on the Case. If this field is blank, Vault displays
|
|
Age (years) |
Vault maps the Age Normalized Years value on the Case. If this field is blank, Vault displays
|
|
Pregnancy Status |
Vault maps the Pregnancy value on the Case.
|